3 Graph Displays
Graphs appear in the Main Window of the following types of screens:
-
Dashboard
-
Overview
-
Analysis
This section describes the types of graphs available on Overview and Analysis screens and provides instructions for modifying their appearance and the data they display. The following topics are discussed:
Areas of the Main Window
All STA Overview and Analysis screens follow the same general structure and layout. The Main Window is divided into a Graphics Area at the top, and a Table Area at the bottom. The border between the two areas is marked by the Collapse Pane icon, which is always visible, and the Resize control bar, which appears when you move the mouse over the space between the two areas.
STA has two types of graphics screens: Overview and Analysis. This section describes graph characteristics and tasks shared by both screen types. See the following sections for characteristics unique to each type.
Description of the illustration ''if_mainwindownotes.jpg''
Types of Graphs
This section describes the types of graphs used in STA. It also describes actions you can perform to get the most information from the graphs.
Line Graphs
Line graphs are used to compare actual values for one or more resources over a period of time. Each line represents a resource (drive or media) or other category of data. Time is always shown on the horizontal axis. Each point on the line represents an actual value at a point in time. There must be at least two data points available for a line graph; if there is only one data point, the graph will display as a bar chart.
Note:
The default date range for most STA line graphs (libraries, complexes, drives, and media) is the last 30 days. For exchanges, the default is one day—the current date.| User Action | Description |
|---|---|
| Display detailed values | Move the mouse over a point in time on a line to display the specific value in a tooltip. Other lines on the graph are dimmed. 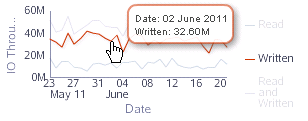 Description of the illustration ''if_linedetail.png'' |
| Highlight values | Move the mouse over an area of the legend to highlight that line on the graph. All other lines remain on the graph but are dimmed. 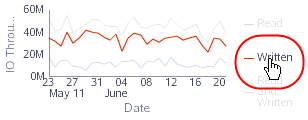 Description of the illustration ''if_linehighlight.png'' |
Area Charts
Area charts are used to compare percentage values for two or more resources over a period of time. An area chart is similar to a line graph, but in addition, the area under the line is filled in with a color or pattern. Each line represents a resource (drive or media) or other category of data, and the size of the area under the line represents the resource's percentage of the total. Time is always displayed on the horizontal axis. Each point on the line represents an actual data value at a point in time.
Note:
The default date range for most STA area charts (libraries, complexes, drives, and media) is the last 30 days. For exchanges, the default is one day—the current date.| User Action | Description |
|---|---|
| Display detailed values | Move the mouse over a point in time on a line to display the specific value in a tooltip. Other sections on the graph are dimmed. 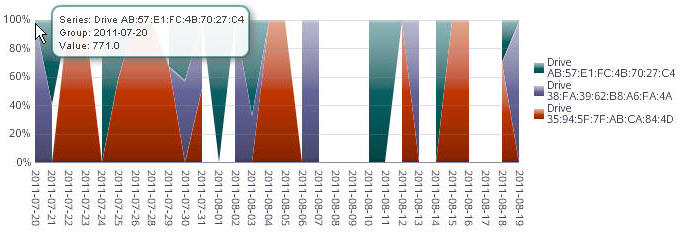 Description of the illustration ''if_areadetail.jpg'' |
| Highlight values | Move the mouse over an area of the legend to highlight that section on the graph. All other sections remain on the graph but are dimmed. 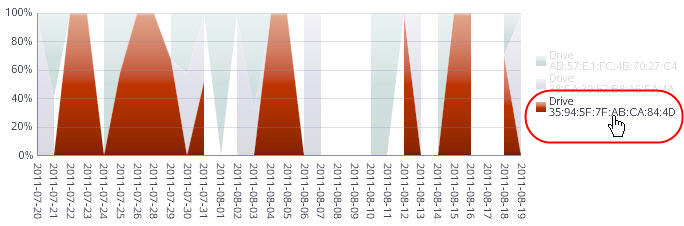 Description of the illustration ''if_areahighlight.jpg'' |
Bar Charts
Bar charts are used to display actual values for one or more resources at a point in time. Each bar represents a resource (drive or media) or other category of data, and the size of the bar represents the resource's actual value.
| User Action | Description |
|---|---|
| Display detailed values | Move the mouse over a bar to display the specific value in a tooltip. Other bars on the graph are dimmed. |
| Link to a detail screen | Note: This action is available from the Dashboard only.
Click an area of the bar to link to the detail screen for that resource type; in this example, the link is to the Drives –Overview screen. The List View table on the screen indicates that a filter has been applied: 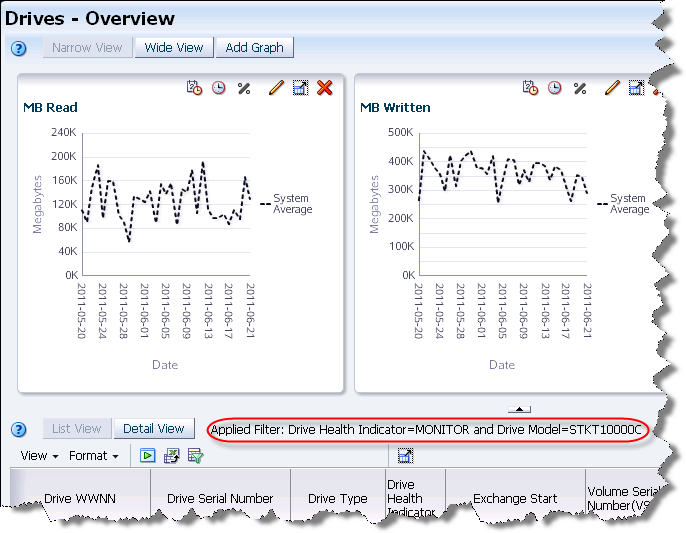 Description of the illustration ''if_barlinktarget.png'' |
| Highlight values | Move the mouse over an area of the legend to highlight that entry in the graph. All other entries remain on the graph but are dimmed. 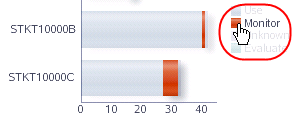 Description of the illustration ''if_barhighlight.png'' |
Pie Charts
Pie charts are used to compare percentage values for two or more resources at a point in time. Each section of the pie represents a resource (drive or media) or other category of data, and the size of the section represents the resource's percentage of the total. To be meaningful, pie charts require graphing at least two resources, as only one resource will take up all of the pie.
| User Action | Description |
|---|---|
| Display detailed values | Move the mouse over a section of the pie to display the percentage value in a tooltip. Other sections of the pie are dimmed. 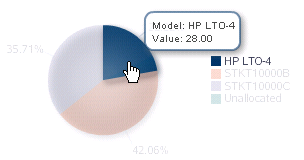 Description of the illustration ''if_piedetail.png'' |
| Link to an Overview screen | Note: This action is available on the Dashboard only.
Click a pie section to link to the Overview screen for that resource type; in this example, the link is to the Drives –Overview screen. The List View table on the screen indicates that a filter has been applied: 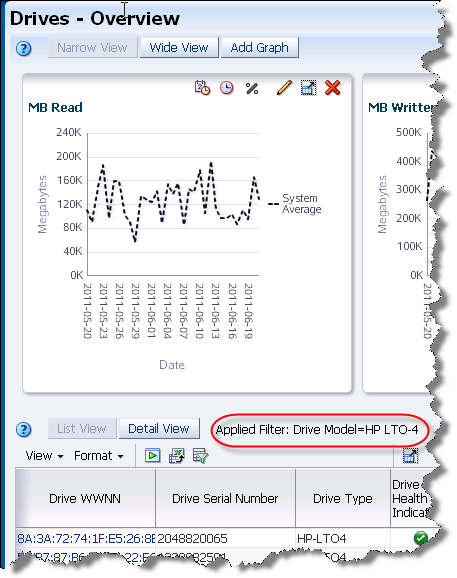 Description of the illustration ''if_pielinktarget.png'' |
| Highlight values | Move the mouse over an area of the legend to highlight that entry in the pie chart. All other entries remain on the chart but are dimmed. 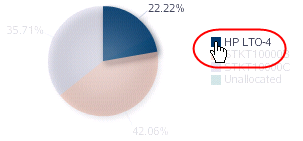 Description of the illustration ''if_piehighlight.png'' |
Spark Charts
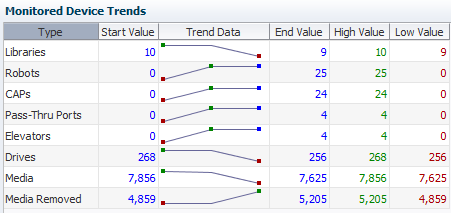
Embedded spark charts are included in some Dashboard table portlets (see the STA User's Guide for table portlet descriptions). A spark chart is a small line graph that plots up to four key values—Start, End, High, and Low—for a selected date range. Spark charts can help you to see patterns in data values over time.
Depending on the date range selected and the variation among the key values, a given chart may have only two or three dots plotted, rather than four. This is because the dot for one value may hide the other if two key values are close in date and value. Filtering for a shorter date range may reveal more detail.
Figure 3-1 through Figure 3-3 show three different date ranges for the same Dashboard portlet. Because all three ranges use the current date as the end date, the End Values are the same for all. The other key values vary, however, as the start date and relative high and low values are different for each range.
Figure 3-1 Monitored Device Trends Filtered for "Less Than 250 Days Ago"
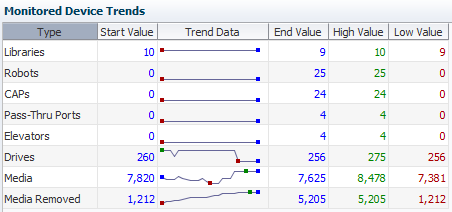
Description of ''Figure 3-1 Monitored Device Trends Filtered for "Less Than 250 Days Ago"''
Figure 3-2 Monitored Device Trends Filtered for "Less Than 30 Days Ago"
Description of ''Figure 3-2 Monitored Device Trends Filtered for "Less Than 30 Days Ago"''
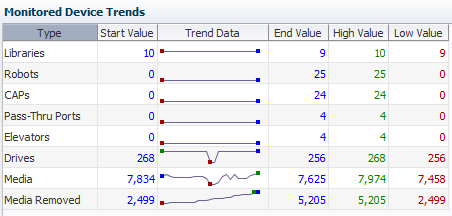
Figure 3-3 Monitored Device Trends Filtered for "Less Than 2 Days Ago"
Description of ''Figure 3-3 Monitored Device Trends Filtered for "Less Than 2 Days Ago"''
Graphs on Overview Screens
The Graphics Area of Overview screens consists of the Graphics Area Toolbar and one or more graph panes. Each graph pane also has a Graph Pane Toolbar. When multiple graph panes are displayed, they are tiled, up to three per row. You can display up to 15 graph panes at a time.
You can modify the data displayed on individual graph panes through any of the following actions:
-
Change the displayed attribute; see "Graphed Attribute" below for details.
-
Change the displayed date range; see "Date Range" below for details.
-
Switch between real and percentage values; see "Real and Percentage Values" below for details.
-
Add individual resources to the graph for direct comparison; see "Individual Records" for details.
Graphed Attribute
Each graph pane displays values for exactly one drive or media attribute. You can change the displayed attribute by clicking the Change Graphed Attribute icon on the Graph Pane Toolbar and then selecting any of the available attributes for that resource type.
See "Change the Graphed Attribute" for detailed instructions.
Date Range
By default, most graph panes display values for the previous 30 days. This is a rolling time period which is updated daily. The exception to this is the graph panes on the Exchanges Overview screen, which display values for the current date only.
You can change the date range by clicking the Choose Date Range icon on the Graph Pane Toolbar. You can then specify new start and ending dates for the range or a point in time (one day). Date ranges longer than one day are displayed as line graphs. Point-in-time graphs are displayed as bar charts. See "Change the Date Range" for detailed instructions.
Once you have specified a new date range for an individual graph, you can apply that range to all graphs on the screen by clicking the Synchronize Date Range icon. See "Synchronize a Date Range Across All Graphs" for detailed instructions.
Real and Percentage Values
By default, the graph panes display actual data values. You can optionally switch to a percentage display, which shows individual resource values as a percentage of the whole. Actual values are displayed as a line graph, and percentage values are displayed as an area graph.
You can switch between actual and percentage value displays by selecting the Show Percentages icon on the Graph Pane Toolbar.
See "Switch Between Actual and Percentage Values – Overview Screens" for detailed instructions.
Units of Measure
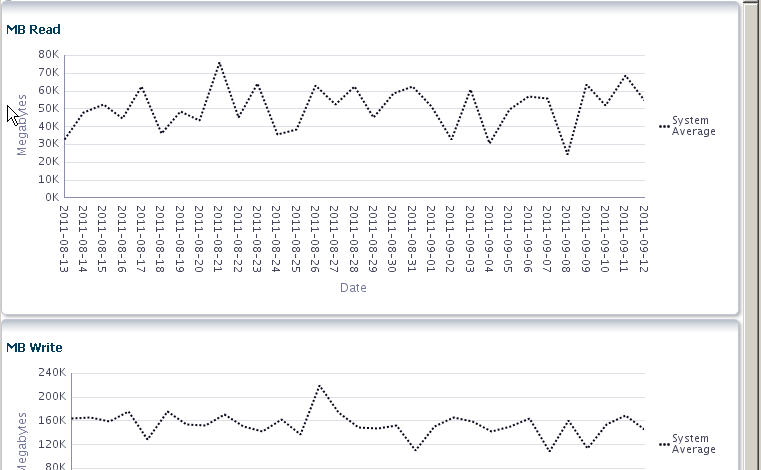
Units of measure are identified on the horizontal and vertical axes of each graph pane. On line and area graphs, which show values over time, time is always shown on the horizontal axis, and the attribute values are shown on the vertical axis. The scale of both axes automatically adjust to provide a useful amount of detail for the values included in the graph.
If the graphed attribute includes a unit of measure, such as MB Read, then the total value of a given data point is the product of the unit of measure included in the attribute multiplied by the unit of measure of the vertical axis. The sample graph panes shown below use different units of measure on their vertical axes.
-
In the MB Read graph, the highlighted data point indicates a value of 88.59K. Because the vertical axis is measured in megabytes, the value of the data point is actually 88.59K megabytes, or 88,590 MB.
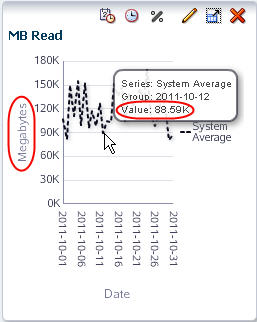
Description of the illustration ''if_gruommultiplier.jpg''
-
In the Dismounts graph, the highlighted data point indicates a value of 2,061. Because there is no multiplier on the vertical axis, the value of the data point is actually 2,061.
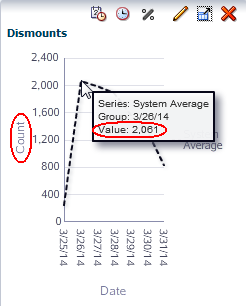
Description of the illustration ''if_gruomnomult.png''
Individual Records
When you first start an Overview screen, the graph panes display only the system average for their selected attribute. You can compare individual resources to each other and the system average by adding the resources to the graphs. You add individual resources by selecting their records on the List View table, and then applying the selection to the graphs. The individual values are then highlighted on the graph, and the system average is ghosted.
You can change the displayed resources simply by selecting different ones and re-applying the selection. If there is no data for a selected resource, no values will appear on the graph, but the resource will be added to the graph key to indicate that it has been selected. When you leave the Overview screen, the selections are cleared, so that when you return, the graph panes again display the system average only.
To clear all resources from the graphs without exiting the screen, you can deselect all records on the List View table, and then re-apply the selection to the graphs.
See "Add Library Resources to Graphs" for detailed instructions.
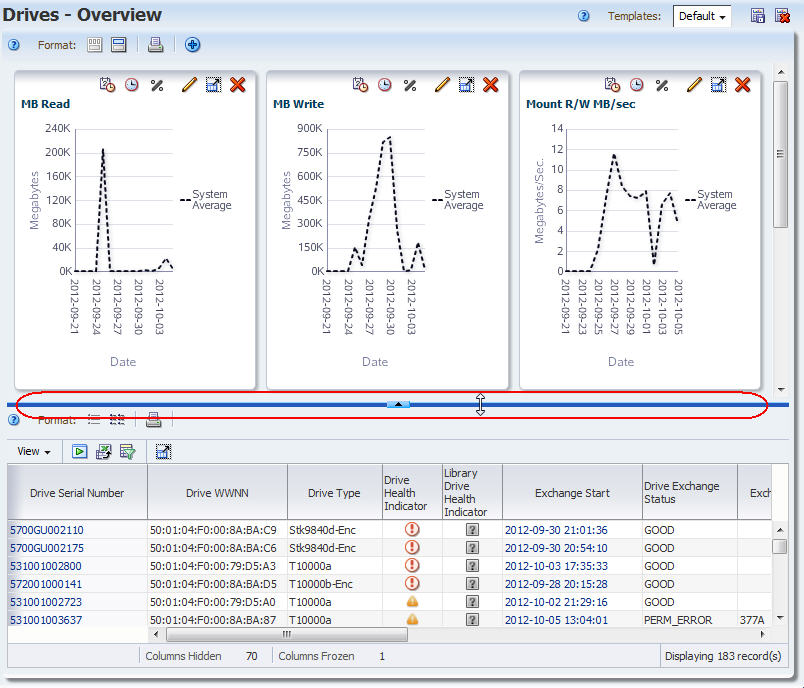
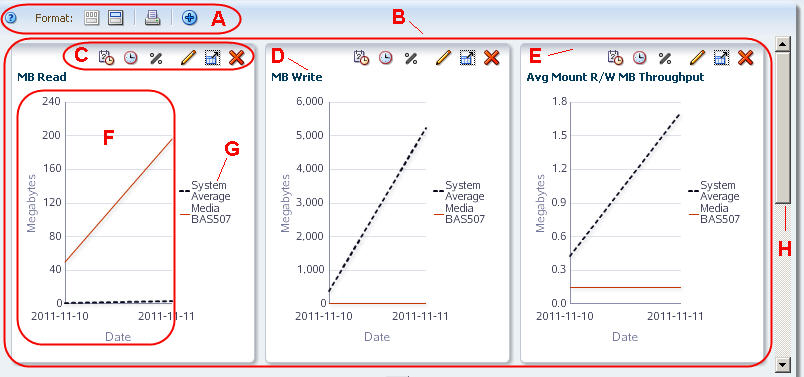
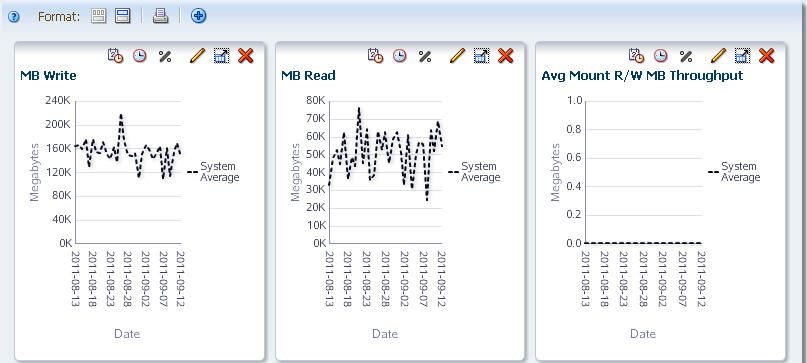
Graphics Area Layout – Overview Screens
Description of the illustration ''if_graphicsovwpane.jpg''
| Item | Name | Description |
|---|---|---|
| A | Overview Graphics Area Toolbar | Provides direct access to commands for managing the Graphics Area. See "Graphics Area Toolbar for Overview Screens" for descriptions of each icon. |
| B | Graphs | Graphs are tiled in rows of up to three. Up to five rows can be displayed. |
| C | Overview Graph Pane Toolbar | Provides direct access to commands for manipulating the display of this graph pane. See "Graph Pane Toolbar for Overview Screens" for details. |
| D | Graph Pane title | Identifies the graphed attribute. |
| E | Graph Pane border | Shaded area at the top of the graph pane. Allows you to grab the pane and move it. See "Rearrange Graph Panes" for details. |
| F | Graph | Area where the body of the graph is displayed. The horizontal axis is always Date, and the vertical axis is the unit of measure for the displayed values. |
| G | Legend | Key to the items included on the graph. |
| H | Vertical scrollbar | Appears only if the there are too many graphs to display in one row. |
Graphics Area Toolbar for Overview Screens
The Overview Graphics Area Toolbar appears at the top of the Graphics Area. It provides direct access to frequently used commands for controlling the overall display of the Graphics Area.
Description of the illustration ''if_toolbargrmainovw.jpg''
| Icon | Name | Description |
|---|---|---|
| Help | Displays help for the Graphics Area.
Related Topic: STA User's Guide |
|
| Narrow View | Tiles graph panes across the Graphics Area in rows of up to three graphs each. This is the default view.
Related Topic: "Switch Between Narrow and Wide Views" |
|
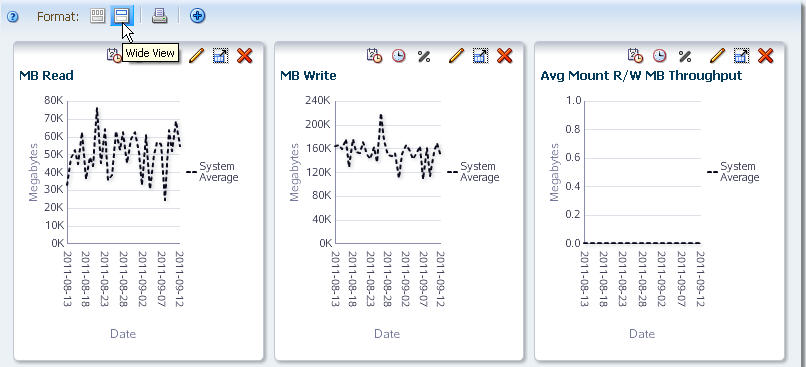
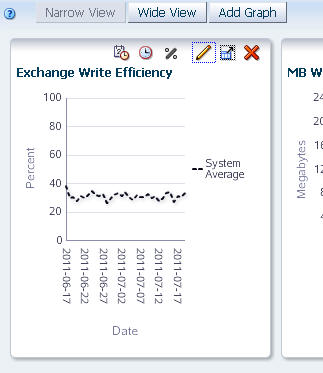
| Wide View | Expands each graph horizontally across the entire Graphics Area with individual graphs stacked vertically.
Related Topic: "Switch Between Narrow and Wide Views" |
|
| Printable Graphs | Provides a "quick print" function. Displays a printable form of the displayed graphs in a separate browser tab or window.
Related Topic: "Perform a Graph "Quick Print"" |
|
| Add Graph | Adds a new graph pane displaying the default attribute to the Graphics Area.
Related Topic: "Add a Graph Pane" |
Graph Pane Toolbar for Overview Screens
The Overview Graph Pane Toolbar appears at the top of each graph pane on Overview screens. It provides direct access to frequently used commands for modifying the graph pane.
Description of the illustration ''if_toolbargrovw.jpg''
| Icon | Name | Description |
|---|---|---|
| Choose Date Range | Displays the date editor, which allows you to change the date range to a new range or a single day.
Related Topic: "Change the Date Range" |
|
| Synchronize Date Range | Applies the date range for the current graphics pane to all graphics panes on the screen.
Related Topic: "Synchronize a Date Range Across All Graphs" |
|
| Show Percentages | Switches between real value and percentage value displays.
Related Topic: "Switch Between Actual and Percentage Values – Overview Screens" |
|
| Change Graphed Attribute | Allows you to change the attribute displayed on the graph.
Related Topic: "Change the Graphed Attribute" |
|
| Detach Pane | Detaches the graph from the screen and displays it in a separate window in the browser foreground.
Related Topic: "Detach a Graph Pane" |
|
| Remove Pane | Deletes the graph pane from the screen.
Related Topic: "Remove a Graph Pane" |
Graphs on Analysis Screens
The Graphics Area of Analysis screens consists of the Graphics Area Toolbar and one or more graph panes. Each graph pane also has a Graph Pane Toolbar.
The default Graphics Area on Analysis screens has just one graph pane, showing summary information for the overall system. The graphed attribute on Analysis screens is always the corresponding—drive or media—Health Indicator.
You can change the number of graph panes and the data they display by selecting different row layers in the pivot table and applying the selection to the graphs. Whenever multiple panes are displayed, the left-most pane always shows summary information, and the remaining panes show detail.
See "Data Graphing Tasks" for detailed instructions.
Graphics Area Layout – Analysis Screens
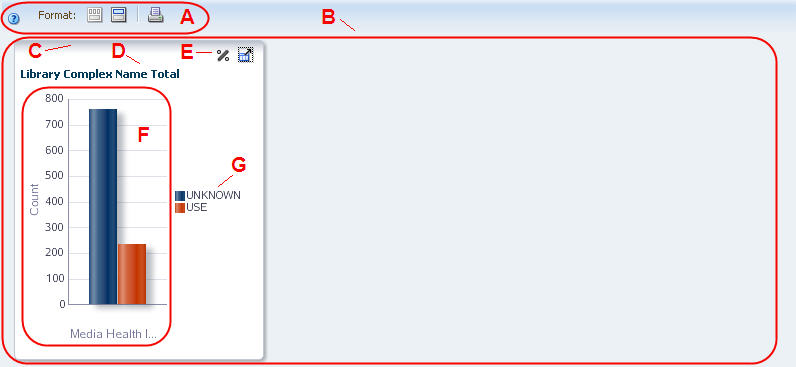
Description of the illustration ''if_graphicsanlyspane.jpg''
| Item | Name | Description |
|---|---|---|
| A | Analysis Graphics Area Toolbar | Provides direct access to commands for managing the Graphics Area. See "Graphics Area Toolbar for Overview Screens" for descriptions of each icon. |
| B | Graphs | Graphs are tiled in rows of up to three. Up to five rows can be displayed. The default view shows one graph only. |
| C | Graph pane border | Shaded area at the top of the graph pane.
Note: Analysis screen graph panes cannot be rearranged. |
| D | Graph pane title | Identifies the graphed attribute. |
| E | Analysis Graph Pane Toolbar | Provides direct access to commands for manipulating the display of this graph pane. See "Graph Pane Toolbar for Analysis Screens" for details. |
| F | Graph | Area where the body of the graph is displayed. |
| G | Legend | Key to the items included on the graph. |
Graphics Area Toolbar for Analysis Screens
The Analysis Graphics Area Toolbar appears at the top of the Graphics Area. It provides direct access to frequently used commands for controlling the overall display of the Graphics Area.
Description of the illustration ''if_toolbargrmainanlys.jpg''
| Icon | Name | Description |
|---|---|---|
| Help | Displays help for the Graphics Area.
Related Topic: STA User's Guide |
|
| Narrow View | Tiles graph panes across the Graphics Area in rows of up to three graphs each. This is the default view.
Related Topic: "Switch Between Narrow and Wide Views" |
|
| Wide View | Expands each graph horizontally across the entire Graphics Area with individual graphs stacked vertically.
Related Topic: "Switch Between Narrow and Wide Views" |
|
| Printable Graphs | Provides a "quick print" function. Displays a printable form of the displayed graphs in a separate browser tab or window.
Related Topic: "Perform a Graph "Quick Print"" |
Graph Pane Toolbar for Analysis Screens
The Analysis Graph Pane Toolbar appears at the top of each graph pane on Analysis screens. It provides direct access to frequently used commands for modifying the graph pane.
Description of the illustration ''if_toolbargranlys.jpg''
| Icon | Name | Description |
|---|---|---|
| Show Percentages | Toggles between real value and percentage value displays.
Related Topic: "Switch Between Actual and Percentage Values – Analysis Screens" |
|
| Detach Pane | Detaches the graph from the screen and displays it in a separate window in the browser foreground.
Related Topic: "Detach a Graph Pane" |
Best Practices for Graph Displays
This section provides tips for using the STA graph displays.
- Hiding graphs
-
The graphs at the top of most Overview screens are often not needed. Use the Collapse Pane button between the graphs and the table to collapse the graphs and make more space for the table. You can save this view as a default template so it is easily applied to the screen.
- System average
-
The dotted black line shown by default in all graphs shows a summary or average across your tape library system. This provides a good comparative baseline.
See "Individual Records".
- Displaying individual values
-
You can add specific resources (drives, media, and so on) to the graphs by multi-selecting them from the table, and then clicking the Apply icon. This is a powerful tool for comparing resources within your tape library system.
- Synchronizing graphs
-
You can synchronize date and time ranges on the Overview screen graphs by clicking the Synchronize Date Range icon on each graph. This provides a good way to compare resources across multiple data ranges—you can change the date and time range in one graph and then synchronize the other graphs to it.
Graph Display Tasks
These procedures allow you to modify the appearance and arrangement of graphs on the STA screen. Some tasks apply to both Overview and Analysis screens, while others apply to Overview screens only; this distinction is identified at the top of each procedure.
Detach a Graph Pane
Note:
This procedure applies to both Overview and Analysis screens.Use this procedure to separate a graph pane from the Graphics Area and display it in a separate window in the browser foreground. Once you have detached a graph pane, you can resize it and move it anywhere within the browser window. You can detach only one pane at a time.
-
Click Detach Pane in the Graph Pane Toolbar.
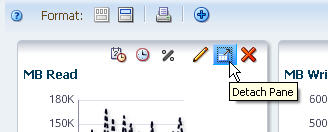
Description of the illustration ''if_graphdetach.jpg''
The graph pane is displayed in a separate window in the screen foreground.
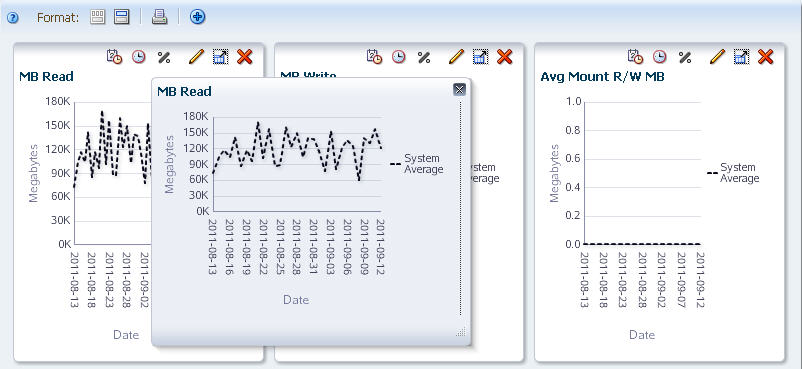
Description of the illustration ''if_graphdetached.jpg''
Note:
If you navigate to another screen, the pane is automatically closed. -
Optionally, you can move or resize the pane as follows:
-
To move the pane, click and drag the top border.
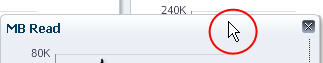
Description of the illustration ''if_panemove.jpg''
-
To resize the pane, click and drag an edge or corner.
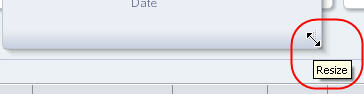
Description of the illustration ''if_paneresize.jpg''
-
-
To restore the graph pane to its normal position, do either of the following:
-
Click Close in the Graph Pane Toolbar.
Description of the illustration ''if_graphclose.jpg''
-
Click Detach Pane in a second graph pane. This restores the first graph pane to its normal position and displays the second graph pane in the foreground.
-
Rearrange Graph Panes
Note:
This procedure applies to Overview screens only.Use this procedure to rearrange graph panes in the Graphics Area. This procedure can be used in narrow view or wide view.
-
Move the mouse over the Graph Pane border of the pane you want to move. The Move Object cursor appears.
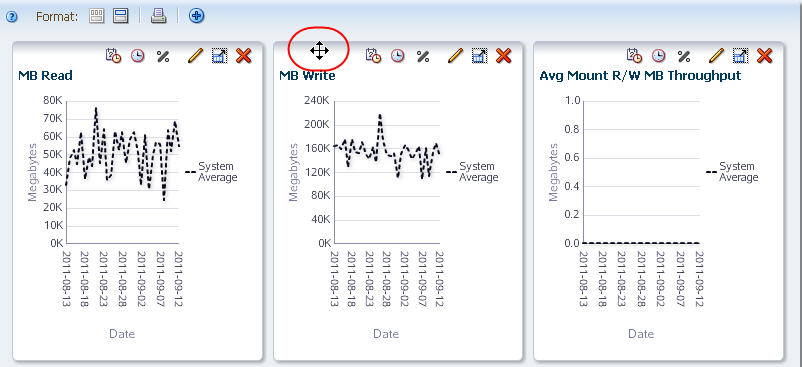
Description of the illustration ''if_grpaneselect.jpg''
-
Click and drag the pane to its new location.
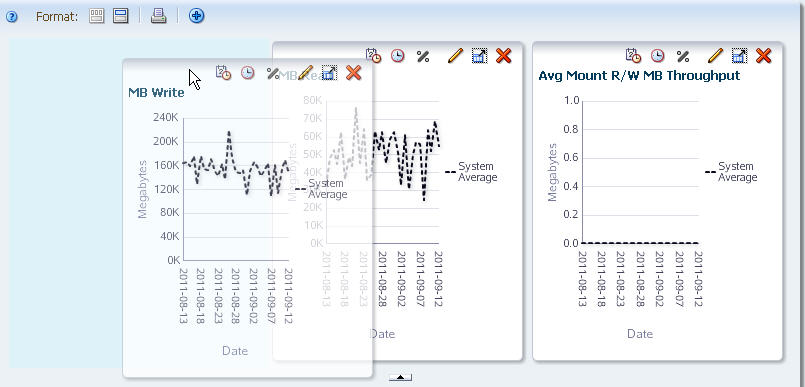
Description of the illustration ''if_grpanemoving.jpg''
-
Once the pane is near the position you want, release the cursor.
The pane snaps into place. You do not need to position it exactly.
Description of the illustration ''if_grpanemoved.jpg''
Add a Graph Pane
Note:
This procedure applies to Overview screens only.Use this procedure to add a graph pane to the screen. Data is displayed in the new graph according to the following criteria:
-
The graph displays the default attribute for the resource type. For media, the default is Data Mounts; for drives, it is MB Read. You can change the attribute to any available attribute for the resource.
-
If the existing graph panes have all been synchronized to the same date range, the new graph uses the same one; otherwise, the graph uses the system default date range of the previous 30 days.
-
The new graph displays actual values, even if all the existing graphs display percentages.
-
If individual resources have been applied to the existing graphs, the new graph displays the same ones.
-
Click Add Graph on the Graphics Area Toolbar.
Note:
You can display up to 15 graph panes at a time; once you reach 15, the Add Graph icon is disabled (dimmed).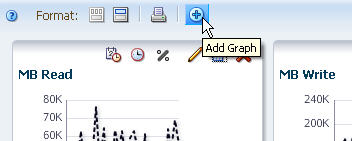
Description of the illustration ''if_graphadd.jpg''
The graph pane is added to the end of the Graphics Area display. You may need to use the vertical scrollbar to view the graph.
-
To move the pane to a new position, see "Rearrange Graph Panes".
-
To graph a different attribute, see "Change the Graphed Attribute".
-
Remove a Graph Pane
Note:
This procedure applies to Overview screens only.Use this procedure to delete a graph pane from the Graphics Area display.
-
Click Remove Pane on the Graph Pane Toolbar.
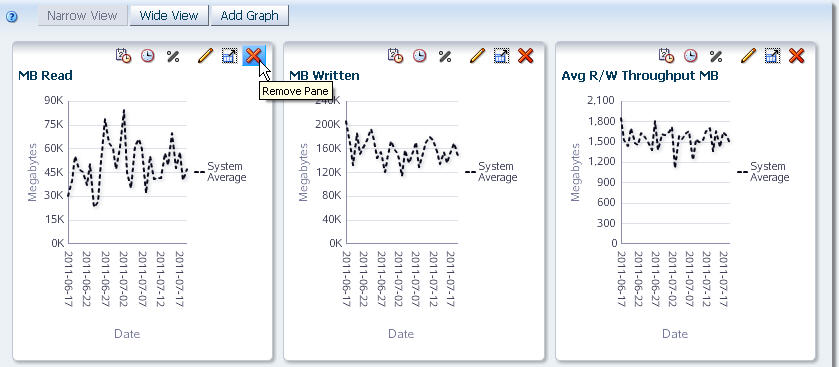
Description of the illustration ''if_grremove.jpg''
The pane is removed from the display.
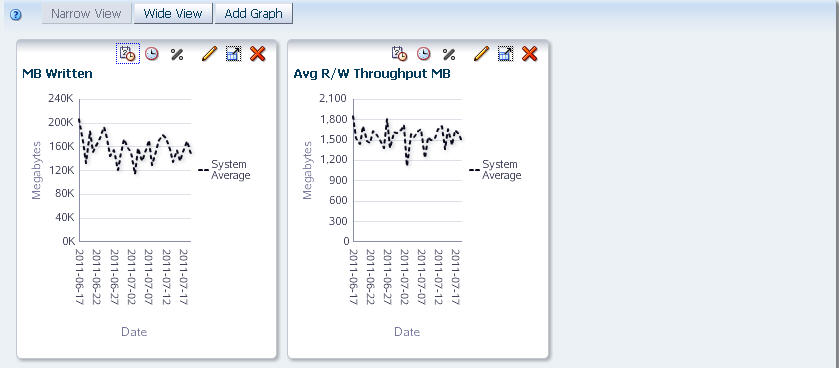
Description of the illustration ''if_grremoved.jpg''
See "Add a Graph Pane" for instructions on restoring the graph pane to the display.
Switch Between Narrow and Wide Views
Note:
This procedure applies to both Overview and Analysis screens.Use this procedure to display graphs in narrow and wide formats. Narrow view is the default, and it allows you to do side-by-side comparisons of graphed attributes. Wide view allows you to see each graph in greater detail.
-
Click Wide View on the Graphics Area Toolbar.
Description of the illustration ''if_grwideview.jpg''
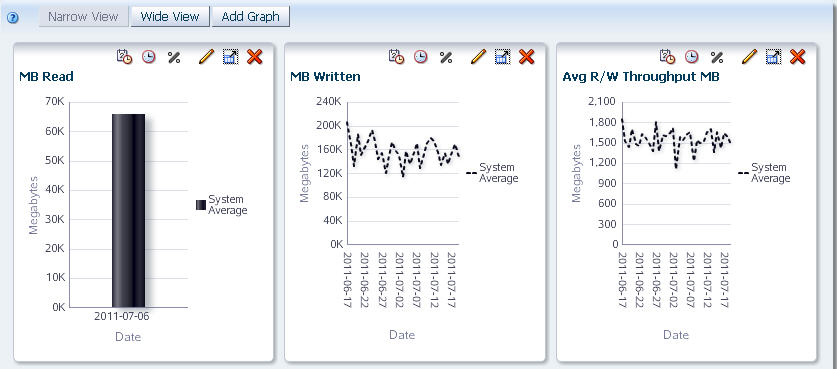
The display changes to wide view, in which each graph pane is expanded horizontally across the entire Graphics Area. A vertical scrollbar appears, allowing you to scroll down to the remaining panes.
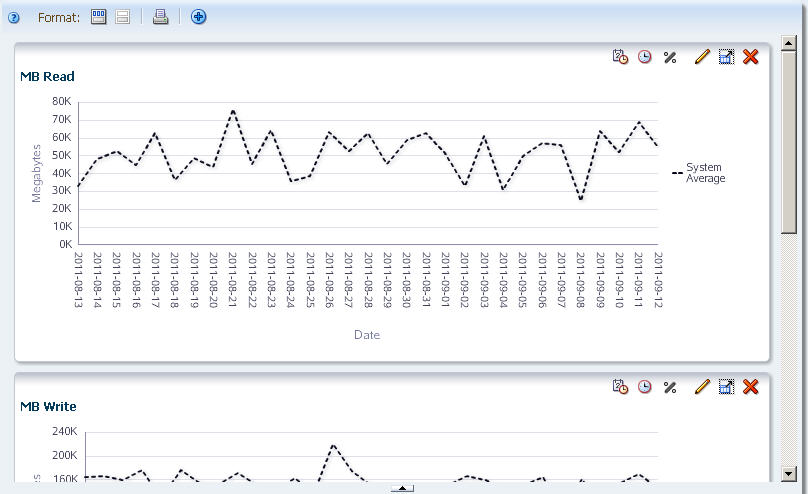
Description of the illustration ''if_grwide.jpg''
-
To switch back to narrow view, click Narrow View in the Graphics Area Toolbar.
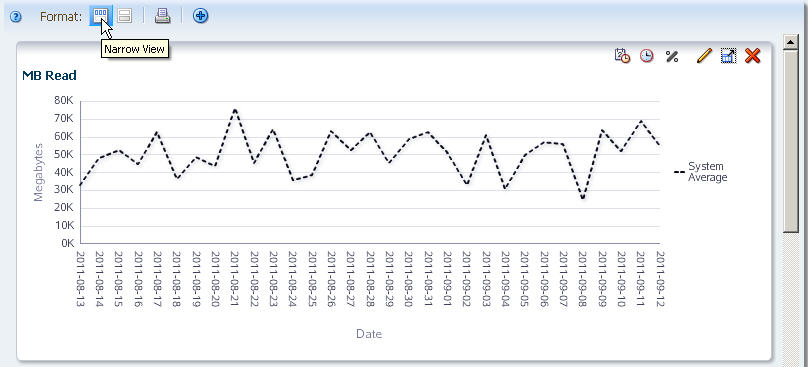
Description of the illustration ''if_grnarrowview.jpg''
Perform a Graph "Quick Print"
Note:
This procedure applies to both Overview and Analysis screens.Use this procedure to perform a "quick print" of all graphs currently displayed.
Note:
For best results, you might want to display the graphs in Wide View mode. This will allow you to see more detail in the printed graphs.-
Click Printable Graphs on the Graphics Area Toolbar.
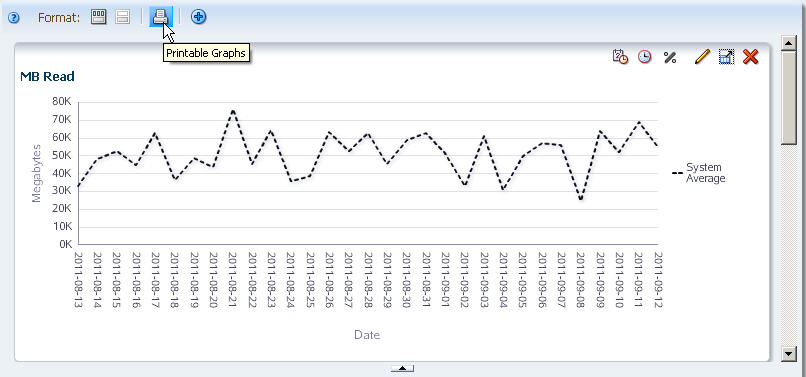
Description of the illustration ''if_grprintable.jpg''
A new tab is created in your browser window, showing all graphs in a printable format.
Description of the illustration ''if_grprintabletab.jpg''
-
You can use your browser's standard Print function to send this display to a printer.
Data Graphing Tasks
These procedures allow you to modify the data that is displayed on one or more graph panes. Some tasks apply to both Overview and Analysis screens, while others apply to only one screen type; this distinction is identified at the top of each procedure.
-
"Switch Between Actual and Percentage Values – Overview Screens"
-
"Switch Between Actual and Percentage Values – Analysis Screens"
Change the Graphed Attribute
Note:
This procedure applies to Overview screens only.Use this procedure to change the resource attribute that is displayed in a graph pane.
-
Click Change Graphed Attribute in the Graph Pane Toolbar.
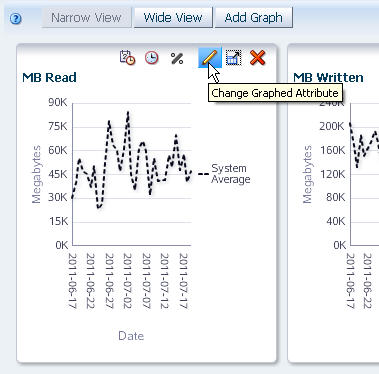
Description of the illustration ''if_grchangeattrib.jpg''
A menu appears, displaying all available attributes for this resource type. Only 14 attributes are visible at a time. A scroll button at the bottom of the menu allows you to scroll down through the entire list.
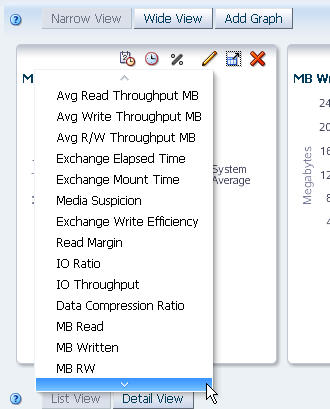
Description of the illustration ''if_grchangeattribmenu.jpg''
-
Select the attribute you want the graph to display.
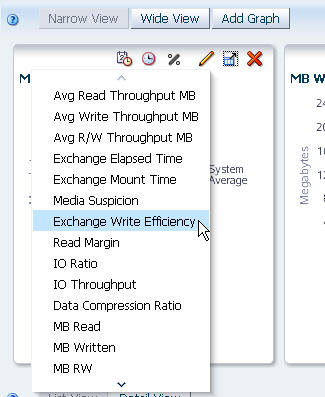
Description of the illustration ''if_grchangeattribselect.jpg''
The graph is updated according to your selection.
Description of the illustration ''if_grchangeattribdone.jpg''
Change the Date Range
Note:
This procedure applies to Overview screens only.Use this procedure to change the date range on a graph pane. You can specify a new range or a point in time (single day).
-
Click Choose Date Range on the Graph Pane Toolbar.
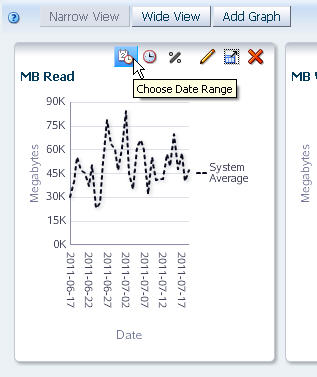
Description of the illustration ''if_grdaterange.jpg''
The Choose Date Range dialog box appears.
Description of the illustration ''if_grchoosedated.jpg''
-
Complete the dialog box, specifying either a single day or a range of dates.
-
For a point in time, do the following:
-
Select the Single Date option.
-
In the Date field, specify the date you want to display. You can type the date manually or click the Select Date icon on the dialog box to display the Date editor and choose the date. The date format is yyyy-mm-dd.
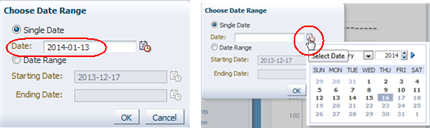
Description of the illustration ''if_datechooser.png''
-
-
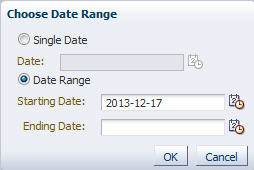
For a range of dates, do the following:
-
Select the Date Range option.
-
In the Starting Date and Ending Date fields, enter the first and last dates of the range. You can type the dates manually or click the Select Date icon on the dialog box to display the Date-time editor and choose the dates. The date format is yyyy-mm-dd.
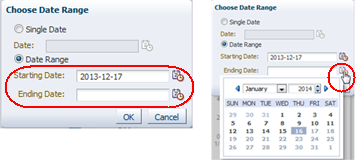
Description of the illustration ''if_rangechooser.png''
-
-
-
When the date selection is as you want, click OK.
The graph is updated according to your selection.
-
New single date (single date graphs are displayed as bar charts):
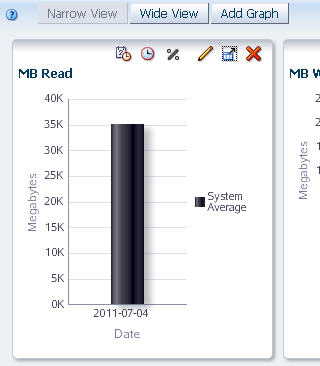
Description of the illustration ''if_grdatepitdone.jpg''
-
New date range (date range graphs are displayed as line graphs):
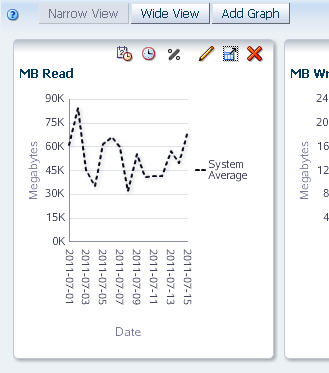
Description of the illustration ''if_grdaterangedone.jpg''
-
Synchronize a Date Range Across All Graphs
Note:
This procedure applies to Overview screens only.Use this procedure to synchronize all graph panes to the same date range.
-
In one graph pane on the screen, set the date range you want to apply to all the panes. See "Change the Date Range" for instructions.
Description of the illustration ''if_grsyncbegin.jpg''
-
Click Synchronize Date Range in the Graph Pane Toolbar of that graph pane.
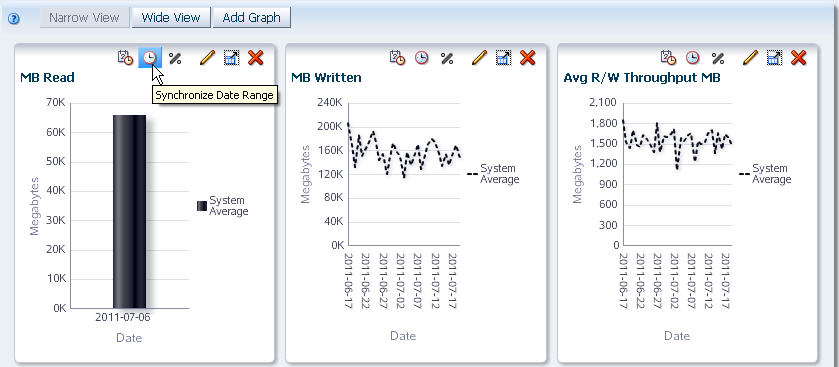
Description of the illustration ''if_grsyncdaterange.jpg''
The Synchronize Graphs confirmation dialog box appears.
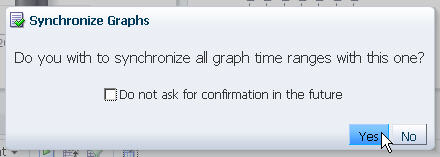
Description of the illustration ''if_grsyncconfirmd.jpg''
-
Click Yes to synchronize.
All graph panes in the Graphics Area are synchronized to display the same date range. All other data display characteristics (graphed attribute, actual versus percentage values, added resources) remain unchanged.
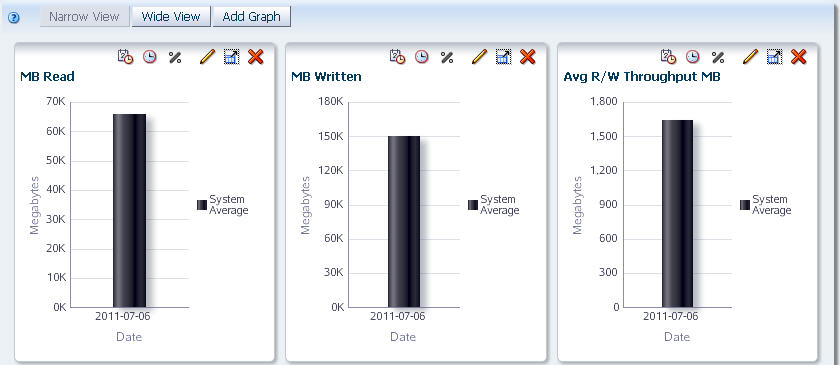
Description of the illustration ''if_grsyncdone.jpg''
Add Library Resources to Graphs
Note:
This procedure applies to Overview screens only.Use this procedure to add selected library resources—such as libraries, drives, media, and so on—to all graph panes on the screen. In the default view, graphs display only the system average for the graphed attribute.
-
In the List View table, select one or more resources.
Note:
You can use multi-select to select more than one resource; see "Multi-select" for details.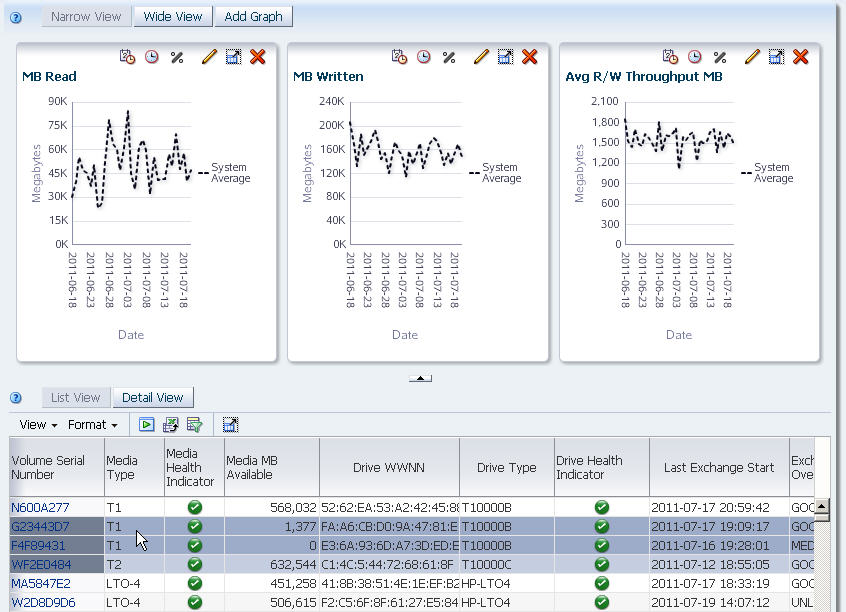
Description of the illustration ''if_grselectres.jpg''
-
Click Apply Selection on the List View Toolbar.
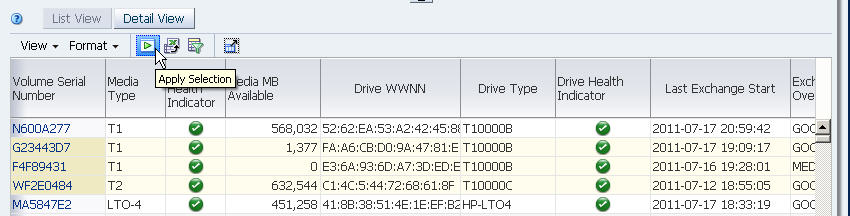
Description of the illustration ''if_grapplyselection.jpg''
The selected resources are added to all graph panes on the screen.
Note:
Depending on the data values for the selected resources, the scale of one or more graph panes may change. The scales of the horizontal and vertical axes automatically adjust to show a useful amount of detail for the selected resources.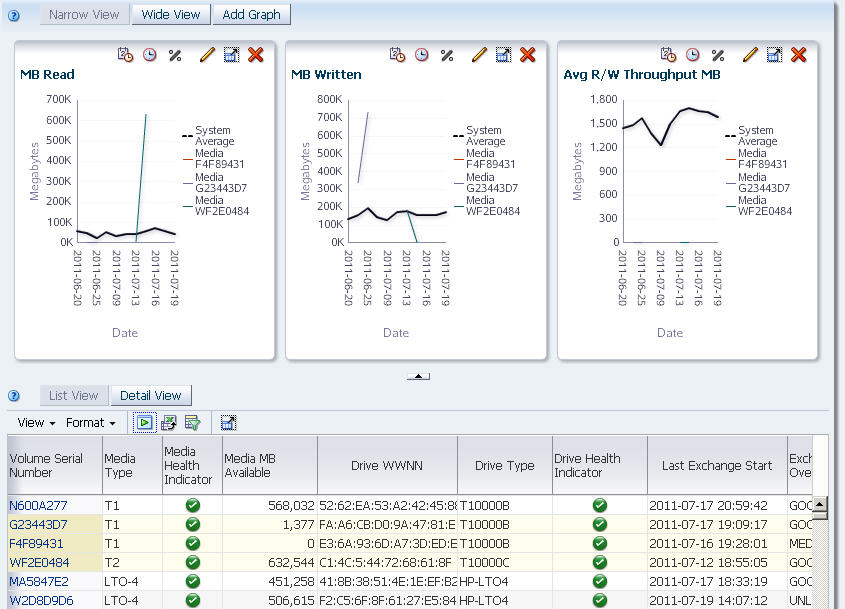
Description of the illustration ''if_grselectapplied.jpg''
-
You can change the selected resources, as follows:
Switch Between Actual and Percentage Values – Overview Screens
Note:
This procedure applies to Overview screens only.Use this procedure to switch between actual and percentage values on a graph pane. Actual values are displayed by default. Percentage values compare individual resources within a set of selected resources; therefore, displaying percentage values is useful only when at least two resources have been added to the graph.
-
Add two or more resources to the graph. See "Add Library Resources to Graphs" for detailed instructions.
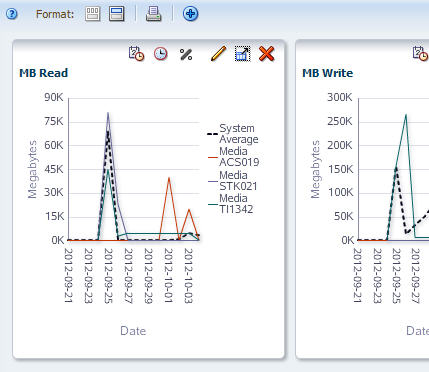
Description of the illustration ''if_grmediaapplied.jpg''
-
Click Show Percentages on the Graph Pane Toolbar.
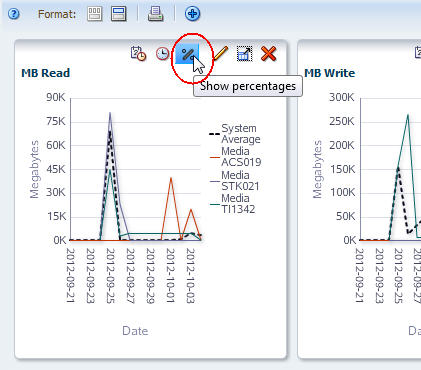
Description of the illustration ''if_grshowpercent.jpg''
The graphed values change from actual to percent, and the line graph changes to an area chart.
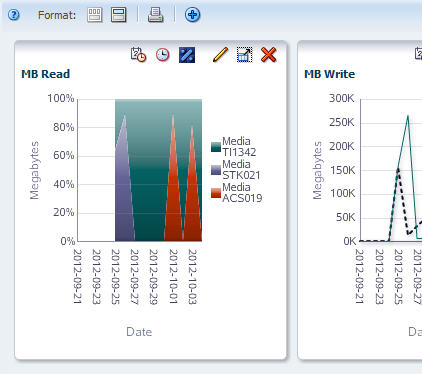
Description of the illustration ''if_grpercentvalues.jpg''
-
The Show Percentages icon acts as a toggle. You can click it again to switch back to actual values.
Switch Between Actual and Percentage Values – Analysis Screens
Note:
This procedure applies to Analysis screens only.Use this procedure to switch between actual and percentage values on a graph pane. Actual values are displayed by default. Percentage values compare individual resources within a set of selected resources; therefore, displaying percentage values is useful only when at least two resources have been added to the graph.
-
Click Show Percentages on the Graph Pane Toolbar.
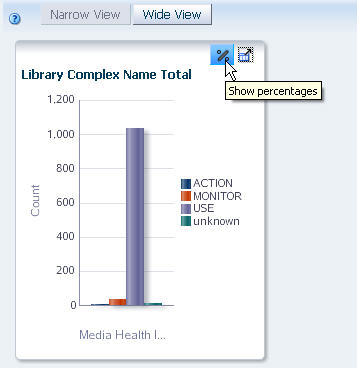
Description of the illustration ''if_grpercentanlys.jpg''
The graphed values change from actual to percent, and the bar chart changes to a pie chart.
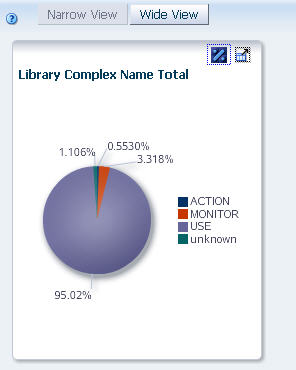
Description of the illustration ''if_grpercentanlysdone.jpg''
-
The Show Percentages icon acts as a toggle. You can click it again to switch back to actual values.
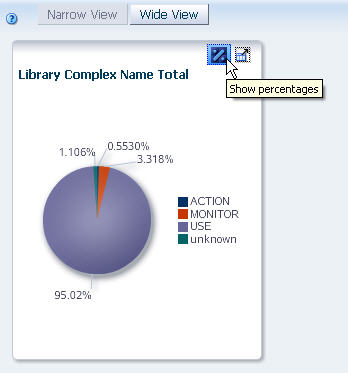
Description of the illustration ''if_grpercentanlystoggle.jpg''
Graph Detail for a Pivot Table Attribute
Note:
This procedure applies to Analysis screens only.Use this procedure to graph detail data for a pivot table attribute. This results in just one graph pane in the Graphics Area.
Note:
You can graph attributes that appear on the row edge only, and only one row at a time. If you select a column edge attribute, or if you select multiple rows, you will see the error, "Please select one and only one row."-
In the pivot table, select a row that shows one value for an attribute.
Note:
In this example, the "HP" value for the Drive Manufacturer attribute is selected.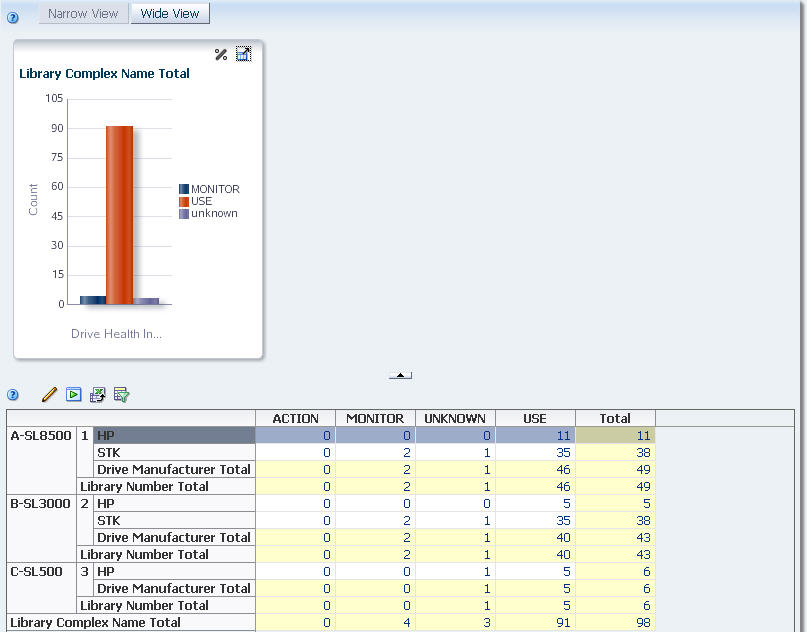
Description of the illustration ''if_grselectrow.jpg''
-
Click Apply Selection in the Pivot Table Toolbar.
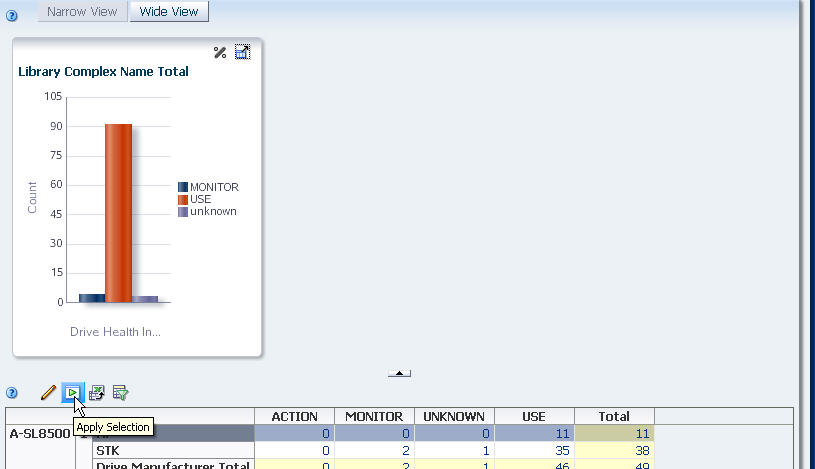
Description of the illustration ''if_grapplyselectanlys.jpg''
The selected attribute value is displayed in a single graph pane.
Graph Aggregated Data From a Pivot Table
Note:
This procedure applies to Analysis screens only.Use this procedure to graph aggregated data from a pivot table. This results in multiple graph panes in the Graphics Area: one for the aggregated totals and one each for the attribute values included in the totals.
Note:
You can graph attributes that appear on the row edge only, and only one row at a time. If you select a column edge attribute, or if you select multiple rows, you will see the error, "Please select one and only one row."-
In the pivot table, select a layer that aggregates multiple attribute values.
Note:
In this example, the nesting layer is "Library Number", which aggregates data for two drive manufacturers: "HP" and "STK".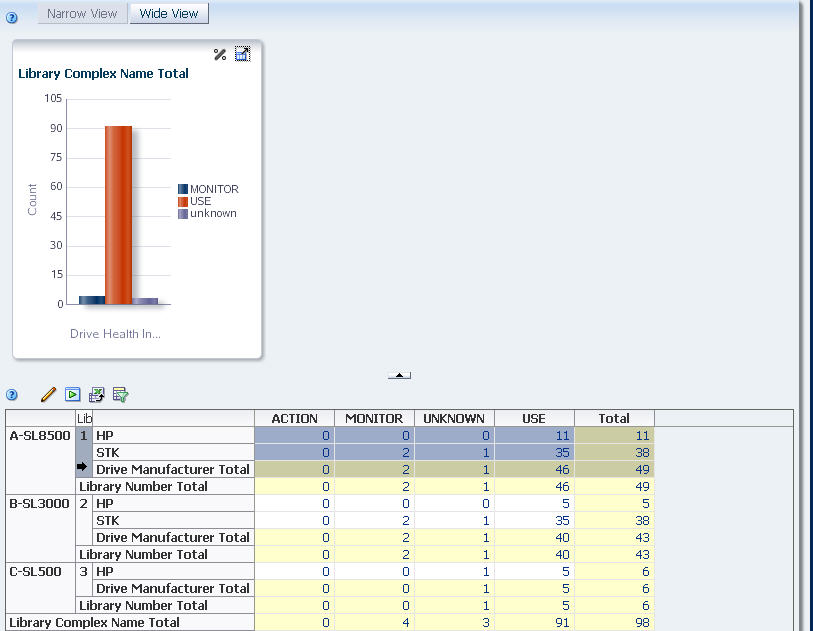
Description of the illustration ''if_grselectnesting.jpg''
-
Click Apply Selection in the Pivot Table Toolbar.
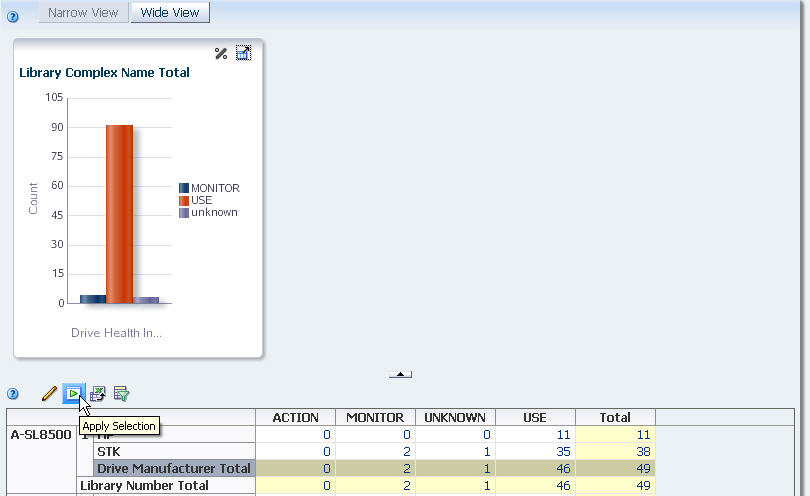
Description of the illustration ''if_grapplysummary.jpg''
The Graphics Area is updated as follows:
-
The left-most pane shows the summary data for the attribute.
-
The panes to the right show detail for each attribute included in the aggregation, one pane per attribute. In this example, there are two detail panes: one for "HP" and one for "STK".
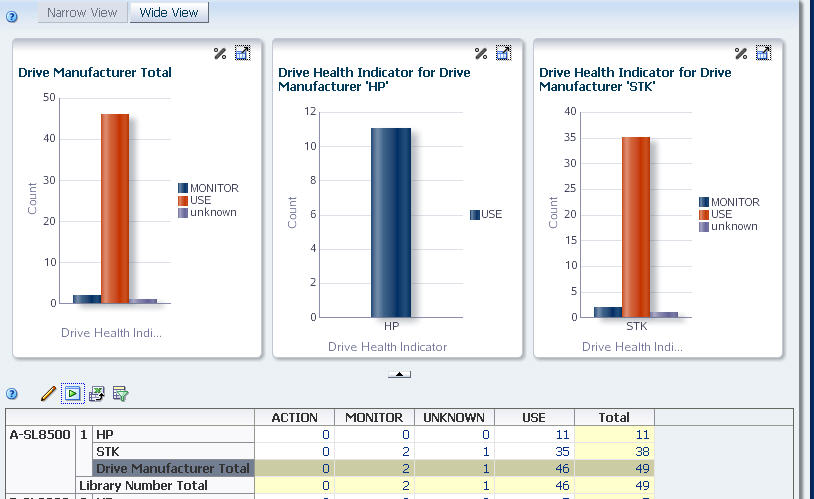
Description of the illustration ''if_grapplysummarydone.jpg''
-