| Agile Product Lifecycle Management Product Cost Management User Guide Release 9.3.6 E71147-01 |
|

 Previous |
 Next |
| Agile Product Lifecycle Management Product Cost Management User Guide Release 9.3.6 E71147-01 |
|
Previous |
Next |
This chapter provides information about analyzing sourcing project data.
In Agile PCM, you can review and analyze a project's item content, including price information and RFQ response information. On the Analysis tab of a project, you can view the item information across all RFQs in the project along with response lines. You can create RFQs and send them to suppliers. You can publish the price information in the response line as well. Costed BOM analysis and other analysis can be performed on product cost information and RFQ response lines.
The table on the Analysis tab displays information such as the supplier name, the item or the manufacturer part number, the revision (if any), the manufacturer, the manufacturer status, and the response line information.
You can select which fields to view on the Analysis tab. You can also filter the data. For more information, see "Filtering Project Data."
The Analysis tab provides support for several analysis features including:
Best Response selection
Costed BOM analysis
Sourcing exceptions
Other cost analysis views and reports
During the sourcing process, you may have to move from tab to tab within the sourcing project to accomplish specific tasks that are necessary to completing the sourcing process.
To improve the efficiency of the sourcing process, however, several key tasks that you could previously only complete on the Items or AML tabs are now available on the Analysis tab. This enables you to remain on the Analysis tab and use the same filters and views that you need to manage project items, AML, and project data analysis. Tasks that have been replicated on the Analysis tab from the AML or Items tabs are still also available on the original tabs.
The following table describes the tasks that have been replicated from the AML or Items tab to the Analysis tab.
| Task | Description | Relevant sections |
|---|---|---|
| Add Items | Items can be added using the following methods:
Create New Search & Add Import Copy/Paste Drag/Drop |
See "Adding Items to a Project" for more information. |
| Remove Items | Remove items at the root level. | See "Removing Items" for more information. |
| Edit Quantities | Edit item quantities for all root items. | See "Modifying Item Quantities" for more information. |
| Expanded Display | Select a root item and click More > Expanded Display to display the expanded BOM in a separate pop-up window. | See "Expanding an Assembly" for more information. |
| Edit Partners | Edit partners. Previously this was only available on the Items and AML tabs. | See "Adding Partners to Project Items" and "Removing Partners from Project Items"for more information. |
| Bulk Edit Items & Bulk Edit Mfr. Parts | Bulk edit items or manufacturer items by clicking Edit > Bulk Edit. | See "Bulk Editing" for more information. |
| Content Update | Update sourcing project content with the latest information from Item Master. Previously, this feature was only available on the Items tab. | See "Updating Project Content from the Item Master"for more information. |
| Update AML from Item Master | Get the latest information for the AML from the Item Master. | See "Retrieving AML Data from the Item Master" for more information. |
| Set Target Costs | Set target costs manually or automatically. Previously, this feature was only available on the AML tab. | See "Setting the Target Price" for more information. |
| Update RFQ Targets | Previously, this feature was only available on the AML tab. | See "Updating Target Prices in RFQs" for more information. |
| Validate Items | Validate items. Previously, this feature was only available on the AML tab. | See "Validating Manufacturer Names" and "Validating Manufacturer Part Numbers" for more information. |
| Publish Content | Publish content by clicking Publish > Prices. | See "Publishing Items and Manufacturer Parts" for more information. |
|
Note: A few of the tasks mentioned in this table are only applicable to root-level items. You can use the Top Level Parts option in the Views drop-down to filter out non-root items. |
In the Analysis tab, you can use filters to see only a subset of data, instead of seeing the whole set. You can use one of the pre-defined filters that are available through the Views drop-down.
The pre-defined filters available through the Views drop-down list are:
Items not in RFQ - Displays those items that are not in an RFQ. If an item has multiple manufacturer parts and one of the parts is not in an RFQ, then the item and that particular part gets displayed.
Items with Sourcing Exceptions - Displays those items that have supplier responses that have exceptions.
Items with Split - Displays those items that have AML with splits among them.
Parts with Best Price - Displays those items or manufacturer parts that have been flagged as "best". A part's price gets flagged as best when you use the Analyze > Set As Best option.
Parts with Price - Displays those items or manufacturer parts that have prices.
Parts without Best Price - Displays those items or manufacturer parts that have not been flagged as ”best.”
Parts without Supplier - Displays those items that do not have prices from suppliers or from the price lookup.
Parts awaiting Response - Displays those items or manufacturer parts that have been sent to a supplier through an RFQ, but have not received a response from the supplier.
Supplier Proposed Alternates - Displays manufacturer parts that have been proposed as alternates.
Top Level Parts - Displays the root-level items.
Alternatively, to specify attributes by which the data should be filtered, you can use the filter functionality that is available through the Personalize button. Multi-column filtering is available on the Analysis tab.
To filter data in a project:
Open a project and click the Analysis tab.
Click Personalize.
Click the Field drop-down list to select a field by which to filter.
Click the Operator drop-down list to select a relational operator for the filter. The list of relational operators depends on the type of attribute selected.
Select a value for the filter criteria.
For text attributes, type a value.
For list attributes, click the list icon to select a single or multiple values from available values list.
To add additional filters, click the Add button.
Click Apply.
To save this filter for future use, click Save. You must then click Save As to save the settings as a new filter.
When the prices are published from the Analysis tab in a sourcing project, the system stamps its publishing date. If, and when, a publish operation fails, the Publish Date field remains empty, however, the Publish Status field will contain a dot icon. The reason for failure is displayed when you mouse over the dot icon in that column.
To be able to identify the failed, or successful, instances, you can filter the Published Prices across their Date and Status using the attributes Publish Price Date and Published Price Status, respectively.
Publish Price Date - You can filter the prices published before, on or after a particular date.
For example, if a few users in your organization published a certain number of responses today, and you want to know how many they were, this attribute lets you do so.
You could also, for example, filter for "Publish Price Date Is Null" to display all the prices that have not been published or that failed to publish.
Published Price Status - You can filter the prices that got published or did not.
To see the list of all unpublished responses, select this filter attribute and "Is not Null" parameter. To see all the responses (published and never published), select "Is Null" parameter.
A costed BOM comparison view enables you to compare prices across multiple partners and the best of component suppliers. Duplicate item rows show the various responses. When you run the Costed BOM Comparison analysis, the system calculates material and non-material costs for each Cost Roll Up.
For material costs, the system takes the material price and applies any price adders specified in the response line. Price adders can be fixed costs or percentages. If the item has AML splits, the system calculates an average for the material costs.
For non-material costs, the system sums all non-material flex fields.
If there are multiple BOM levels, the system rolls up material costs for each level of the BOM hierarchy to calculate the Total Materials Price for each subassembly and assembly. If you do not see any costs while in the Costed BOM view, it is most probably because a cost rollup has not been run yet for the project using the Calculator button.
|
Note: If you modify the current price period for analysis purposes only, be sure to change it back before creating any new RFQs for the project. |
The following table shows an example of a costed BOM with a subassembly.
Table 5-1 Example of Costed BOM with a Subassembly
| Number | Cost | Quote As | QPA | Total Unit Cost | Total Materials Price | Total Non-Materials Prics |
|---|---|---|---|---|---|---|
|
A1 |
Yes |
Assembly |
1 |
20.50 |
18.00 |
2.50 |
|
P2 |
Yes |
Component |
1 |
2.00 |
2.00 |
0.00 |
|
P3 |
Yes |
Component |
2 |
3.00 |
3.00 |
0.00 |
|
P4 |
Yes |
Component |
3 |
1.00 |
1.00 |
0.00 |
|
A2 |
Yes |
Assembly |
2 |
3.50 |
2.50 |
1.00 |
|
P5 |
Yes |
Component |
1 |
1.50 |
1.50 |
0.00 |
|
P6 |
Yes |
Component |
1 |
1.00 |
1.00 |
0.00 |
The Cost and Quote As fields determine how prices are rolled up for the Costed BOM. If the Cost field is set to No, pricing information cannot be entered for that item and it appears gray. The Quote As field sets whether the item is quoted as an assembly, component, or custom component.
If Quote As is set to Assembly, the Total Materials Price field will be the sum of the Total Materials Price fields from all its sub-components.
If Quote As is set to Component, the Total Materials Price field is entered on the response line and is not calculated. Total Non-Materials Price is not entered for components.
If Quote As is set to Custom Component, the Total Materials Price field is entered on the response line and is not calculated. The Total Non-Materials Price field also becomes enabled. The Total Unit Cost field equals the sum of the Total Materials Price and the Total Non-Materials Price fields.
The total cost is only rolled up for partners, not best of suppliers. A partner is an Original Equipment Manufacturer (OEM). OEMs deal with the complete assembly rather than individual parts. For example, let us assume that Company A is an OEM for Company B. If Company B needs a quote for B1234 laptop, Company A gives the costs for the complete assembly and its parts. Non-material costs are incurred to assemble the parts at different sub-assemblies and assemblies. Agile PLM rolls up the costs to the top-level assembly by multiplying the costs by the QPA.
A supplier, however. is an Equipment Manufacturer (EMS). An EMS deals with individual parts. For example, Company C is an EMS of Company B, which needs a quote for different parts for the B1234 laptop, like CPU and memory. Company C only gives costs for the parts. Even if Company C does deal with assemblies, Company A treats it as an EMS, which means that the application assumes that the EMS/supplier will not give costs for a complete assembly. Therefore, total costs are not rolled up at the top-level assembly for supplier-provided responses.
To view the costed BOM comparison:
Open a project and go to Analysis tab.
Choose Analyze > Costed BOM Comparison. The Costed BOM table appears showing duplicate item rows, one for each partner or the best supplier. All Partners and only the Best Supplier are displayed in the Costed BOM View.
For items with a split percentage, an average is calculated.
For items with no split percentage, the lowest price response is provided across all partners or suppliers.
|
Note: If your project includes price periods, the lowest cost is based on the current price period. Best Response is selected based on the criteria mentioned while performing Set As Best. But Lowest Price Response will not be provided across all the Partners & Suppliers, each Partner/Supplier will have his own Response Line. If there are multiple quantity breaks per price period, the first quantity break is used. For information about how to calculate costs for a different price period, see "Modifying Price Scenarios". |
|
Note: When you perform Cost Roll Up, Costs will be calculated for all the Price periods present in the Project. For selecting the Best supplier for a specific Price period, you need to mention Price Period in "Select the Price Scenario To Analyze". |
To view information for a selected price scenario, click the Price Scenarios drop-down list and select either Default Price Scenario, All Price Scenarios, or Selected Price Scenarios.
If you chose Selected Price Scenarios, select price scenarios in the Hidden Fields list, and then click the right arrow to add them to the Displayed Fields list. Click OK.
Click OK to return to the Analysis tab.
After you have created a costed BOM comparison, you can quickly export the results to a text file.
To export a costed BOM comparison:
Open a project and go to the Analysis tab.
Choose Analyze > Costed BOM Comparison. The Costed BOM table appears showing duplicate item rows, one for each partner or supplier.
Click the Export button. The Export Assembly Cost (Sourcing Project) dialog appears.
To recalculate costs, make sure the Recalculate Costs Upon Report Execution box is checked.
Select the Assembly Lines, Suppliers, and Price Scenarios to export.
Click Finish to generate the report.
The File Download dialog box appears.
Click Save to save the costed BOM comparison information as an Excel Comma Separated Value (CSV) or Worksheet (XLS) format file to your computer.
Click Close.
Click Return to return to the Analysis tab.
The non-material cost comparison displays the non-material total cost and the non-material cost breakdown. Prices could be taken from associated RFQs or from price lookups. This view lets you compare the non-material costs provided by various suppliers.
The following table shows an example of a Non-Material Comparison.
| Number | Rev | Commodity | Supplier | Quantity Break 1 - Quantity | Total Non- Materials |
Quantity Break 2- Quantity | Total Non- Materials |
|---|---|---|---|---|---|---|---|
| A1 | A | ASSY | EMS1 | 100 | 2.50 USD | 200 | 5.0 USD |
| A1 | A | ASSY | EMS2 | 100 | 2.25 USD | 200 | 4.0 USD |
| A1 | A | ASSY | EMS3 | 100 | 2.00 USD | 200 | 4.0 USD |
| A2 | B | ASSY | EMS1 | 500 | 8.00 USD | 1000 | 16.00 USD |
| A2 | B | ASSY | EMS2 | 500 | 6.00 USD | 1000 | 12.00 USD |
| A2 | B | ASSY | EMS3 | 500 | 5.00 USD | 1000 | 10.00 USD |
| A3 | C | ASSY | EMS1 | 200 | 20.00 USD | 400 | 40.00 USD |
| A3 | C | ASSY | EMS2 | 200 | 15.00 USD | 400 | 30.00 USD |
| A3 | C | ASSY | EMS3 | 200 | 12.00 USD | 400 | 24.00 USD |
When you run a non-material comparison, you can display AML-related columns like MPN number, manufacturer, AML status, and so on for those items that have AML and are set to custom component. Each manufacturer part is displayed in its own row in context with its parent item. If an item does not have any AMLs, but was quoted as custom component, it still appears in this view.
To view a non-material cost comparison:
Open a project and select the Analysis tab.
Choose Analyze > Non-Material Comparison. The non-material costs appear.
To view information for a selected price scenario, click the Price Scenarios drop-down list and select either Default Price Scenario, All Price Scenarios, or Selected Price Scenarios.
If you chose Selected Price Scenarios, select price scenarios in the Hidden Fields list, and then Click the right arrow to add them to the Displayed Fields list. Click OK.
Click Return to return to the Analysis tab.
|
Note: To see a breakdown of any non-material fields (apart from totals), those fields need to be enabled in the Java Client in the Sourcing Projects Class > Analysis Tab > Attributes:Non Material Price Entry. Only the attributes that are enabled in this tab in the Java Client are visible in the Non-Material Comparison view. |
Agile PCM offers a selection of analysis reports, which provide information directly from a project. You generate analysis reports from the project Analysis tab. These analysis reports include flex fields from Items, Manufacturer Parts, and RFQ Response lines.
The following table describes the analysis reports:
| Report | Description |
|---|---|
| AML Differences | Displays changes made to the AML through validation or from supplier responses. |
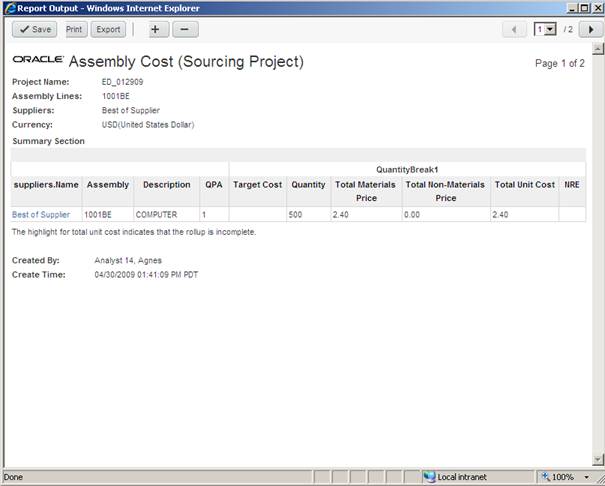
| Assembly Cost | Establishes a total costed BOM, including material and non-material costs, and displays assembly-level and component-level breakdowns. The Supplier Assembly Cost Report also has the QPA and Total Extended Cost (UnitCost*QPA) fields. |
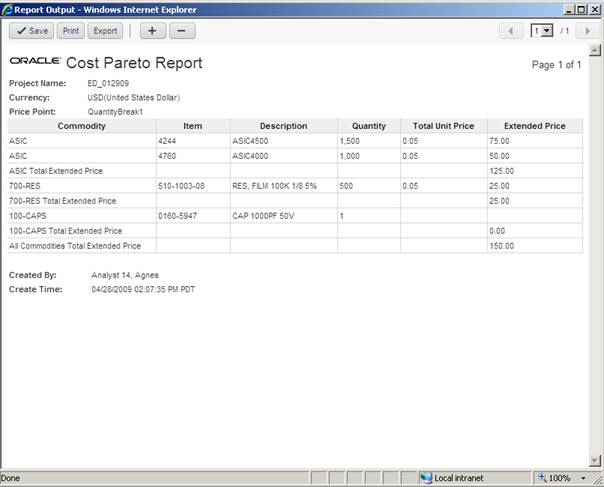
| Cost Pareto | Identifies the items or commodities in a project that have the greatest impact on total cost; also known as the 80/20 analysis. |
| Effective Cost Comparison | Compares the effective extended cost accounting for minimum order and package quantity requirements. |
| Supply Base Analysis | Evaluates the price differences between multiple suppliers and applies discounts to strategic suppliers for further analysis. |
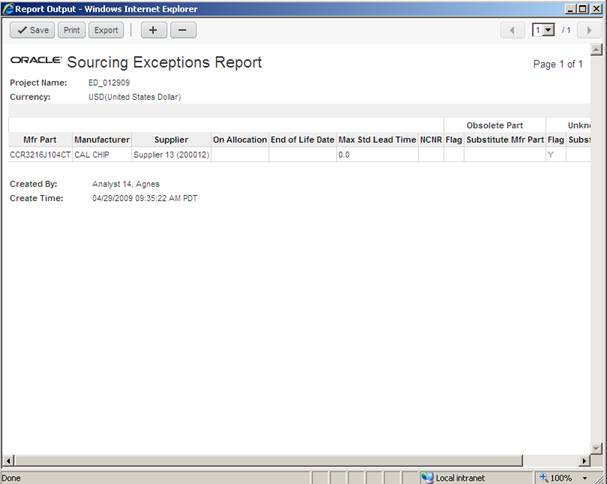
| Sourcing Exceptions | Establishes potential sourcing issues by letting you quickly view sourcing exceptions for project items. The exceptions are based on supplier responses, displaying obsolete and long lead-time items, EOL dates, or unknown part numbers. |
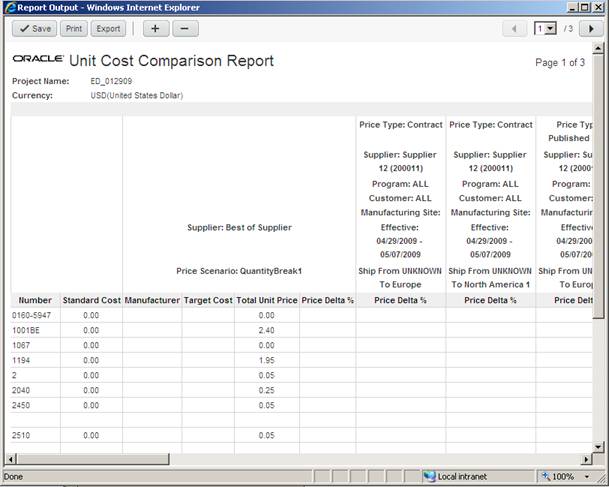
| Unit Cost Comparison | Compares the material and non-material unit costs between multiple suppliers and internal reference cost sources, highlighting the lowest price across all price sources. |
| Response Comparison | Compares the costs and terms between two different sourcing projects. |
|
Note: The Unit Cost Comparison, Effective Cost Comparison, and Response Comparison reports enable comparison of response lines against selected target cost(s). You have the option to select target cost(s). |
There are a few business use cases that may require you to run specific analysis reports. The following table provides a breakdown of which reports to run according to the use case scenario.
| Use Case Scenario | Description of Scenario | Time Frame of Analysis | Reports to Run |
| Commodity Management | This is a common business scenario in which you need to evaluate the aggregate volume costs and supplier/material risks of items and AMLs. | Quarterly or forward pricing (4 qtrs) | To analyze costs:
Unit Cost Comparison Cost Pareto (Optional) Response Comparison To analyze risk: Sourcing Exceptions (optional) AML Differences |
| Co-Sourcing | In this scenario, you are faced with the need to evaluate product cost leverage and risk across suppliers and manufacturing partners. | Single period (1 qtr) or sometimes multiple periods, for example, current + 2-3 quarters forward cost | To analyze material costs:
Assembly Cost Report Unit Cost Comparison Cost Pareto (optional) Response Comparison To analyze risk: Sourcing Exceptions (optional) Effective Cost Comparison (optional) AML Differences |
| Design for Cost & Supply | In this scenario, you are faced with the need to evaluate product cost and risk across product lifecycle. | 1-3 years forward cost (proto period, pilot, early product or full production ramp) | To analyze costs:
Assembly Cost Report Unit Cost Comparison Cost Pareto (optional) Response Comparison (optional) Effective Cost Comparison (optional) Supply Base Analysis To analyze risk: Sourcing Exceptions (optional) AML Differences |
| External Manufacturing: New Business Acquisition | In this scenario, you must analyze pricing to win new business. | If trying to win new business: Quantity-based.
If re-pricing: Time-based, 1 quarter. |
To analyze costs:
Assembly Cost Report Unit Cost Comparison Cost Pareto Effective Cost Comparison (optional) Response Comparison To analyze risk: Sourcing Exceptions (optional) AML Difference (optional) Supply Base Analysis |
You can run reports directly from within an open sourcing project.
To generate an analysis report from within a sourcing project:
Open a project and select the Analysis tab.
Select the item(s) you want to include in the report, and then choose Analysis > Reports & Analytics > (report name). The report wizard appears.
Alternatively, you can run sourcing reports without having to open a project. This is useful in situations where you need to run several reports, but do not need to interact with any particular sourcing projects. You can run reports without opening a sourcing project, by accessing the Reports drawer in the left pane.
To generate an analysis report from the Reports drawer:
Click the Reports drawer in the left pane.
Navigate to sourcing reports by clicking Reports and Analytics > Standard Reports > Sourcing Reports.
Click the name of the report that you want to run.
Click Execute. In some cases, as part of the report wizard, you will have to select the project that you want to run the report on.
For general instructions for generating a report, see Getting Started with Agile PLM.
The following four sections describe, in more detail, the procedures for generating the four most commonly used reports:
Assembly Cost
Cost Pareto
Sourcing Exceptions
Unit Cost Comparison
You can use the Assembly Cost Report to understand the total cost of a BOM. You can also use the report to compare total costs between multiple manufacturers and determine the impact of non-material and material cost differences.
To run the Assembly Cost Report
Open a sourcing project and select the Analysis tab.
Select the item rows you want to include in the report, by clicking the corresponding row selection cells or the All Rows Selection cell.
Select Analyze > Reports and Analytics > Assembly Cost Report. The Assembly Cost Report wizard appears.
On the Select Layout and Configuration page, select the Layout you want to use.
Click Next.
Select the Assembly Lines you want to include in the report. Only top-level assemblies are available for selection.
|
Note: If running this report for a supplier response, rather than a project, both top-level and subassemblies are available for selection. |
Select the Suppliers you want to include in the report. Project partners and best of suppliers are available for selection.
Select the Price Scenarios. All available price scenarios from the project are available for selection.
Optional: If desired, select the check box to "Recalculate costs upon execution."
|
Note: If this option is selected, the report dynamically runs a new costed BOM roll-up. |
Click Finish.
The following is an example of the report output.
You can use the Cost Pareto report to identify key items or commodities with the greatest impact on total cost. Based on report results, you can then focus your price negotiation efforts on those items and commodities that have the greatest impact on total cost.
To run the Cost Pareto report
Open a sourcing project and select the Analysis tab.
Select the item rows you want to include in the report, by clicking the corresponding row selection cells or the All Rows Selection cell.
Select Analyze > Reports and Analytics > Cost Pareto Report. The Run Cost Pareto Report wizard appears.
On the Select Layout and Configuration page, select the Layout that you want to use.
Click Next.
Select the Grouping Options that you want to include in the report. The grouping options that are available depends on the layout you chose in the previous step.
|
Note: All leaf-level items from selected commodities or items are included in the analysis. |
Optional: Enter a percentage value (0 to 100) to filter the results of the analysis based on the commodities' contribution to the total cost.
Select the Cost for Analysis options. You can select up to four different criteria, such as Standard Cost, by which the costs should be compared.
|
Note: If the system finds a price for an item based on the first option, it returns that price. If not, the system continues to try the other criteria. Items/commodities without a value for any of the four costs, are then displayed with empty cost fields in the report. |
Select the Price Scenario that should be considered in the analysis.
|
Note: Only price scenarios from the project are available for selection. |
Click Finish.
The following is an example of the report output.
The Sourcing Exceptions report enables you to identify exceptions that are a signal of high risk, such as parts approaching end-of-life, parts with long lead times, or parts with no alternate sources. Once you have identified the high risk situations, you can take appropriate measures to eliminate the risks.
To run the Sourcing Exceptions report:
Open a sourcing project and select the Analysis tab.
Select the item rows you want to include in the report, by clicking the corresponding row selection cells or the All Rows Selection cell.
Select Analyze > Reports and Analytics > Sourcing Exceptions Report. The Run Sourcing Exceptions Report wizard appears.
On the Select Layout and Configuration page, select the Layout that you want to use.
Click Next.
Select the check box for the sourcing exceptions, such as Obsolete Parts, that you want to report.
|
Note: Some sourcing exception options also require that you enter a time period (in days). For example, to find parts that are near their end of life date, you must enter a number to indicate how close the parts are to that date. |
Optional: Select specific Price Scenario(s) to include in the report.
|
Note: Only price scenarios from the project are available for selection. |
Click Finish.
The following is an example of the report output. Sample
The Unit Cost Comparison report enables you to monitor costs to identify opportunities for proactive cost management with suppliers and partners. You can compare costs between suppliers, and compare costs to existing reference costs, such as standard costs, target costs, and contracts. Based on results from the analysis, you may want to renegotiate with suppliers to realign prices and set targets to match market prices.
To run the Unit Cost Comparison report
Open a sourcing project and select the Analysis tab.
Select the item rows you want to include in the report, by clicking the corresponding row selection cells or the All Rows Selection cell.
Select Analyze > Reports and Analytics > Unit Cost Comparison Report. The Unit Cost Comparison Report wizard appears.
On the Select Layout and Configuration page, select the Layout that you want to use.
Click Next.
Select the Suppliers and Price Scenarios you want to include in the report. The project prices that will be included in the report are based on the suppliers and price scenarios chosen here.
|
Note: In the Suppliers field, the Best of Suppliers/Partners option is available for selection. |
Click Next. The Compare Against Reference Prices page appears.
Click Add. You must add reference prices from the Item Master to compare to the sourcing project prices that were provided by the suppliers you selected in the previous step.
On the Add Scenario page, complete the fields, as desired. Some fields, such as Price Type, are required for defining the price comparison scenario.
|
Note: You can narrow down the comparison scenario by specifying the desired Program, Customer, Ship To location, and so on. |
Click Finish. The reference prices from the added scenarios appear on the Compare Against Prices page.
Click Next.
Choose one base price to which all other prices listed should be compared. Select the row by clicking its row selection cell.
|
Note: All of the sourcing project prices, and the prices from the Item Master, that you selected in the previous steps are listed here. |
Click Finish.
The following is an example of the report output.
You can analyze the supplier responses to find out which supplier response is the best for a given item. By setting the best response, you flag it to track your selection and make that selection available for use in other analysis features and reports. You can set best responses either manually or by the auto-select process.
|
Note: Any manually set best responses are over written when the Rollup Cost Report is run, since auto-set as best is executed as part of the report process. |
You can have only one response per item (and its AMLs) as 'best', with an exception for when AML splits are utilized. In such a case, each AML with nonzero splits can have a best response.
The best response is indicated by a dot icon in the Best Response field. If the Best Response field is not visible, click Personalize to add it to the list of selected attributes.
You can also apply constraint factors, for example, lead-time, so that only qualified responses can be set as best.
To set the best response manually:
Open a sourcing project and select the Analysis tab.
Select the row(s) of one or more response lines in the Analysis table.
Choose Analyze > Set As Best. The system automatically selects the lowest price among all the suppliers and flags it as best.
To auto-select the best response:
Open a sourcing project and select the Analysis tab.
Select the row(s) of the response lines in the Analysis table from which you want to find the best response.
Choose Analyze > Auto-set as Best. The Auto-Select Responses dialog appears.
Select the Content Selection Criteria.
Choose the price scenario to which the rules should be applied. You can apply auto-select to all Items, or just selected Items. By default, the All Items option is selected.
Although only a single scenario can be selected, the Best Response flag is applied to the Response Line as a whole. Only one Response Line shall be set as the "best" per Item. Therefore only a single supplier / partner can be selected as having the "best" Response Line for that Item. If another Response Line had previously been set as the Best Response for an Item, the new selection shall override the previously selected Best Response.
|
Note: There is one exception to the rule of having one "best" per Item, and this is in the case where an Item has an AML split percentage. In this case, the system shall support multiple "best" response selections, one per AML entry with a nonzero split percentage. |
Select the additional criteria for finding the best response:
Alternate Parts - Select this check box to find the best response for the selected items and manufacturer parts among the preferred and alternate parts in the Analysis table.
Historical Quote Responses - Select this check box to find the best response for the manufacturer part from the item's quote history (if any).
From the Best Response Selection Criteria drop-down, select up to three of the following criteria by which to auto-select best responses:
Lowest Cost - Selects the best response based on which has the lowest cost.
Lowest Cost Within Lead Time Constraint - Selects the best response based on the lowest cost within a specified lead time constraint (in days).
Shortest Lead Time - Selects the best response based on which has the shortest lead time.
Supplier Rating - Selects the best response based on supplier ratings. You can prioritize the list of ratings. Your Agile administrator can customize the supplier ratings as required. The default ratings are Approved, Offered Active, Offered Inactive, and Strategic.
AML Preferred status - Select the best response based on AML status. You can prioritize the list of AML status types. The Agile administrator can customize the AML status types as required. The default AML status types are Preferred and Alternate.
Click Auto-Select.
Before you send out an RFQ to suppliers, you may choose to do a price lookup on items in your sourcing project. The lookup process retrieves prices from the Item Master and creates responses on the Analysis tab. These prices can then be used as base prices for the suppliers.
When you no longer need these responses, you can remove these responses or any other responses from a sourcing project if they are not already part of an active RFQ.
To remove responses from a project:
Open a project and select the Analysis tab.
Select the response line(s) you want to delete.
Click Edit > Remove > Responses.
You can delete items from a project to eliminate items that were added or imported by mistake, or that are now obsolete. You can delete an item from a project at any time, as long as it is not a sub-item within a BOM structure. You cannot change the BOM structure within Agile PCM. When you delete an item from a project, it is removed from all RFQs in the project.
Deleting an item from a project does not affect the Item Master. Published items exist in the Item Master even after deletion.
|
Note: Only root-level items can be selected for removal. |
To remove items from a project:
Open a project and select the Analysis tab.
Select the item you want to delete.
|
Note: You may choose to use the Top Level Parts view to display only root-level items, which enables you to easily see which items you can remove. |
Click Remove > Items.
Price adders are essentially overhead rates. Price adders can be the additional cost of an item, apart from the material cost, such as the intellectual property value, the royalty value, and so on. You can add as many price adders as you want. Your Agile administrator can customize the price adder fields to meet your needs. The price adder fields are common to all projects.
Price adder fields can be enabled for suppliers or for buyers (for internal purposes). In the Analysis tab, a buyer can only set price adders that have been enabled for internal purposes. If there are price adders that are enabled for suppliers, only suppliers can set them during the RFQ process; those fields cannot be set by the buyer. For more information, see Agile PLM Administrator Guide.
If a price adder field is enabled for suppliers, the field must also be selected as one of the Response Required Fields in the RFQ or project. Suppliers can enter price adders for each quantity break in the response line.
You can apply internal price adders by Part, Commodity, or Supplier. When you apply internal price adders by:
Commodity - Each commodity is listed so that you can include a unique price adder percent or a fixed amount for each one.
|
Note: Price adders are automatically inherited by the parts that belong to a commodity. |
Part - The price adders are applied only to the parts that you select.
|
Note: You cannot select multiple parts to apply price adders universally. |
Supplier - You get the list of all the suppliers that have been associated to the current project, not necessarily only to the part that you selected. Price adders are applied to all response lines associated with the supplier, as in a penalty for the selected supplier(s)' performance.
|
Note: All costed BOM rollups and reports apply the price adders to the total material cost, regardless of whether suppliers can see the field. |
Using SmartRules, you can also regulate whether price adders can have zero or negative values. You can use the Zero Value For Material Price Adder Fields SmartRule and the Negative Value For Material Price Adder Fields SmartRule to either "Allow" or "Disallow" a user from setting a price adder to 0 or a negative value, respectively. You can also set the SmartRules to "Warning", which is the default value.
To Apply Price Adders:
Open a project and select the Analysis tab.
Select the row(s) of the items for which you need to add price adders.
Choose By Part, By Commodity, or By Supplier in Analyze > Apply Price Adder. The corresponding Apply Price Adders dialog appears.
Enter the price adder information for each item for each quantity break.
Click Apply.
|
Note: You can use the Fill-up and Fill-down buttons to copy a price from one row to the rows above or below it. |
You can verify the existence of a price for a specified period and quantity in the Item Master. If a part already has a price, you can decide whether you still want to create an RFQ for that part, or whether you want to use the price you already have. You can either use the price information of the item, or you can modify the price information and send the RFQ to suppliers for requote.
In Agile PCM, there are three types of prices that are available out-of-box:
Contracts - Pre-defined agreements with your suppliers for item prices over a specified time period.
Published Prices - Item price information that has been published from other projects to the Item Master.
Quote Histories - Quoted prices that were previously received for an item.
When you look up data for a particular item or manufacturer part, the price and response fields are updated with data that you can leverage in your analysis process. You can have any number of price types, which are configured in the Java Client as Price subclasses. All those price types are displayed when you do a price lookup so that you can choose the price type the application should be searching for when it does a price lookup.
You can look up prices of any type of price that is configured in the Java Client.
Contract prices are pre-defined prices from the potential contractors or suppliers for a specified period. By looking up existing contracts with suppliers, you can save time by pulling contract-pricing information from the Item Master directly into the project BOM. The contract information is specific to suppliers, sites, programs, and effectivity periods. If multiple contracts meet the required criteria, the information from the contract with the lowest unit price appears. However, when you view the contract information, you can view all the contracts for the supplier and part.
Price information associated with items in the Item Master is called published prices. Prices for a part can be published after you have finished price negotiations with a supplier. For more information about publishing prices, see "Publishing Prices for Items and Manufacturer Parts". You can use the published price for items in the project.
Quote histories are created automatically from supplier responses when you lock or close a response line. Therefore, you have a record of price quotes from suppliers even if those prices are not published to the Item Master.
When deciding on how to populate the prices, consider the following example. Assume that an RFQ has two price scenarios, Q1 & Q2, and you want to look up prices for Q1. The system will try to find a price based on the "base scenario," which is Q1. If the All Price Scenarios option was selected, once the system finds a price, it will use the same price (Q1's price) for Q2 and update both scenarios with the same price. If just one scenario was chosen, only that one is updated.
|
Note: Selection of the Price details depends on the Look Up criteria mentioned. It can be Lowest Price or Shortest lead time or Most recent Response. |
To look up prices:
Open a project and select the Analysis tab.
Select the row(s) of the item for which you want to look up pricing information.
Choose Edit > Price Lookup. The Price Lookup from Item Master dialog appears.
Select a price scenario from the Base Scenario drop-down list.
Click the button next to the Price Types field. Select either Contract, Published Price, or Quote History.
Decide whether to Populate Price to all scenarios or just one.
Enter the quantity deviation, in percentage, if you select that option, or select the Ignore Quantities button to ignore the quantity.
Enter the number of days from the RFQ date range, plus or minus, within which the quotes have been received or select the Ignore the date ranges button to ignore the date of quote.
|
Note: This date range criterion is only applied to sourcing projects with effectivity periods. In sourcing projects with quantity breaks, all prices are considered regardless of the date range. |
Enter the number of days before the current date to consider quotes that occurred within that period.
Select the Lowest Price, Lead time, or Most recent response button to filter the results if multiple rows are retrieved.
Optional: You can also specify the following search criterion:
Ship To Location
Supplier(s)
Program(s)
Customer(s)
Click Look Up.
You can look up partner pricing for all pricing that you are authorized to view. For example, you can look up pricing information before creating an RFQ.
There are two ways to use this feature:
Price object has two suppliers; a primary supplier and an authorized supplier. Project lookup will create a response price line for the primary supplier if both suppliers are present in the lookup criteria's supplier list and this price is picked up during project lookup.
Multiple suppliers are present in the lookup criteria, and they all appear in the authorized supplier list of a price object and that price is used during lookup, the first qualifying supplier appearing in the price object's authorized supplier list will be picked up for response price line creation in the project. The authorized supplier list on the price object will be used as a priority list to determine which supplier gets picked up during project lookup.
Instead of looking for prices from the price repository, you can look for prices from parts in another sourcing project. In this case, you must pick which price scenario you want to look up in the other project. If the same part exists in both projects, the system gets the best price from the other project and applies it to the current project.
To look up prices:
Open a project and select the Analysis tab.
Select the row(s) of the item for which you want to look up contract pricing information.
Choose Edit > Lookup Prices From a Project. The Price Lookup from Sourcing Project dialog appears.
Select a sourcing project from which you want to look up prices.
Optional: Select the supplier(s) to which you want to narrow down your search.
Optional: You can choose to include or not include the following:
a. Prices that are not flagged as best
b. Items that do not have matching revisions
Click Continue.
Using the drop-downs, select the price points from the source sourcing project that you want to map to each of the target sourcing project's price points.
Click Look-up.
You can publish as much price information as you get for each item or manufacturer part. You can use the published price information for items and manufacturer parts in other sourcing projects.
On the Analysis tab, you can publish response line information for selected items and manufacturer parts. You cannot, however, publish the response line information when the response is pending.
When you publish prices, you can use Redlining or Authoring mode. To create redlines for price line data, you must specify a PCO. Once prices are published to the product record, they are searchable and viewable from the Prices tab in an item or manufacturer part.
When you attempt to publish a price, the manner in which prices are published is based on how the part was quoted during the quoting process.
If a part is quoted as a:
component, only material prices get published.
assembly, non-material prices get published. (See note below.)
custom-component, both material and non-material prices get published.
If you choose to publish an assembly, and if that assembly has rolled up material prices, the application publishes both the rolled up material prices and the non-material prices. The rolled up price is published even if it is partial, however, there will be no indication in the price repository that the price is partial. The supplier that provided the non-material prices is also used when publishing the rolled up prices. If the assembly does not have non-material prices, the prices for the assembly will not be published, regardless of whether there is a partial rolled up material price.
|
Note: Regardless of how the part was quoted, rolled up prices are partner-specific. Only the values corresponding to the assigned partner are rolled-up and published. |
The price publishing process supports large amounts of price items. Each item is published in a single transaction so that if one price item fails to publish, it will not affect the publishing of the other items.
Each failure is reflected in the Published Price Status column with a dot icon.
In addition to publishing prices contained in a project, you can publish items and manufacturer parts. For more information, see "Publishing Items and Manufacturer Parts"
To publish item prices:
Open a project and select the Analysis tab.
Select the row(s) of the response lines that you want to publish to the Item Master.
|
Note: You should look for the best responses and publish those to the Item Master. |
Choose Publish. The Publish to Item Master dialog appears.
Set the following options:
Publish - Select specific price scenarios or you can choose to publish for all price scenarios.
Price Type - Select a Price type. The price types provided with Agile PLM are Contract, Published Price, and Quote History, but your company may implement other types.
AutoNumber Source - This drop-down list appears once you select a Price Type. If a Price Type has more than the default AutoNumber Sources, the list facilitates selection of one.
AML Prices - Select Publish AML Pricing to Manufacturer Parts to only publish the AML price(s). Select Publish AML Pricing to Items to publish AML price(s) to Item(s). This will display the Item price and AML prices in Prices tab under Item Master. This feature is beneficial when Agile PCM extracts/feeds an ERP system, enabling other users (such as a different manufacturing site) to refer Item prices and their AML prices.
Assembly Price - Select Best of Supplier roll up/Partner roll up option.
Publish Mode - Select either Update (redlining) or Authoring mode.
If you select Authoring mode, you can update existing price lines if the parent price is unreleased and does not have a pending Price Change Order (PCO). Authoring mode is helpful when you are importing price lines for preliminary prices. Once a price has a pending PCO, you can no longer use Authoring mode to update its price lines.
If you select Redlining mode, you must specify a PCO to publish updated prices. Redlining mode, as its name implies, highlights in red any price lines that have changed. All prices imported in Redlining mode appear on the Affected Prices tab of the specified PCO.
Change Order - Click to the Search button to select a PCO. You can select an existing PCO or create a new one.
|
Note: If any existing prices to which you are publishing are already subject to a pending PCO, you cannot publish updated prices until the PCO is released. |
Update Mode - The "Only add and modify data only (do not delete it)" setting updates price lines without deleting rows. If you choose "Add, modify, and delete data," existing price lines are completely replaced with the published price lines, potentially deleting price line data.
Publish Error Stops - The publishing prices process can stop due to errors resulting from a PCO that is not closed, or a manufacturer part number in the sourcing project that does not exist in the Item Master, etc. Once the system encounters an error, it terminates the price publishing process immediately. You can choose from 50 or None.
To minimize the amount of stops due to publish errors, you can select 50 from the Publish Error Stops drop-down list. This makes the system carry on with the publishing of the prices despite the errors, and stops the process only when the 50th error occurs.
If you select the None option from the drop-down list, the system continues to attempt publishing for all responses, irrespective of the number of errors it encounters.
Click Publish items to Item Master.
|
Note: If an error occurs when you publish prices, a dot icon is displayed in the Published Price Status column. When you mouse over the dot icon, you can see a description of the error. If the Published Price Status field is not visible, click Personalize to change the selected attributes on the Format tab. |
|
Note: When you re-publish a response that has been modified, instead of overwriting the existing price line, a new price line is created. One of the attributes that determines price line uniqueness is the Date Effective From field. This field is automatically set once a supplier sends in a response. Therefore, once the response line is published, if the modified price line m published again, the Date Effective From field will not be the same as the original, so the system creates a new price line. |
In Agile PCM, you can convert any currency to the project currency by the currently prevailing conversion rates. Suppliers can quote the rates in their currency, which you can convert to the project currency for calculations. You can track and view normalized and original conversion rates.
Some currency conversion features provided with Agile PCM include the following:
systemwide currency conversion table for storing conversion rates.
Ability to create snapshots of project conversion rates for analysis purposes.
Supplier responses are stored in their original quoted currency.
Prices in historical responses and contracts are normalized based on the snapshot conversion rate.
Ability to refresh conversion rates.
|
Note: The only place currency exchange rates affect Agile PCM is on the Analysis tab of a sourcing project. Currency conversion is not an automatic process. From the Analysis tab, you can switch between normalized currency rates and the original currency values entered by suppliers. Elsewhere in Agile PCM, currency conversion rates do not apply. For example, you can configure your system to have money fields on Page Two or Page Three of items. If you change the currency for a money field (for example, from USD to GBP), the field value is not automatically recalculated for the new currency. You can also switch between Original & normalized currencies in the RFQ Responses tab. |
Normalized currency is the project currency. Normalizing the currency is converting the value of the supplier's response quote to the project currency. Agile PCM normalizes response currencies to the default currency specified in the project by applying the conversion rate.
|
Note: Conversion calculations are performed in the background based on the prevailing conversion rates. |
To view normalized currency rates:
Open a project and select the Analysis tab.
Select More > View in Project Currency. The information in the table is refreshed.
The original currency is the currency the supplier uses in quotes. When you view supplier responses, you view them in the suppliers' currency by default.
To view original currency rates:
Open a project and select the Analysis tab.
Select More > View in Project Currency. The information in the table is refreshed.
|
Note: By default, the currency view is Original. |
When you refresh conversion rates in a project, all currencies are normalized based on any new rates stored in the conversion rate table. However, this does not apply to the published response items in the project.
In addition, Agile PCM makes a snapshot of the latest conversion rates used to re-normalize the project currency fields.
|
Note: The Agile administrator can update the conversion rates. For more information, see Agile PLM Administrator Guide. |
To refresh currency conversion rates:
Open a project and select the Analysis tab.
Choose More > View Latest Currency Rates. The View Conversion Rates dialog appears.
Click Update to update response line prices other than the published item prices in the project.
After you have completed your sourcing activities, you can quickly export the results to an Excel file. You can export the responses as a flat list of responses and prices.
To export price information:
Open a project and select the Analysis tab.
Select the item response line(s) you want to export.
Choose More > Export (xls) or More > Export (csv), depending on the file type you want to export (Microsoft Excel Workbook or CSV). The File Download dialog box appears.
Click the Save button to download the file.
You can use the bulk edit feature to edit an entire list of items or a set of select items when you need to make a universal change to any of the following:
standard item fields
flex item fields
standard manufacturer part fields
flex manufacturer part fields
flex response fields
Data can be edited in bulk in the following two locations:
AML tab - enables you to edit item and manufacturer part fields. Standard fields (like item description, manufacturer part description, and so on) and flex fields are bulk-editable in this view.
Analysis tab - enables you to edit standard and flex item and manufacturer part fields. Additionally, flex response fields are bulk-editable in this view.
|
Note: You can edit AML status and split percentage on a per-item basis, by clicking on the item number. |
To Bulk Edit in the Analysis tab:
Open the sourcing project and select the Analysis tab.
Select the desired row(s) of item(s) or select all rows by clicking the All Rows Selection cell.
Select Edit > Bulk Edit. It opens up Bulk Edit dialog.
Select a field from the Attributes drop-down list and enter a value in the corresponding Value field.
To change more attributes, click the Add button to open up more Field and Value rows.
|
Important: The Attributes drop-down list contains only those attributes, such as RESPONSE_TEXT01, that have been set Visible in Java Client. For more information on enabling Flex Field Attributes, see the Agile PLM Administrator Guide.The flex attributes enabled in the source table such AML.ITEMS, AML.AML, RFQ.RESPONSE and in ANALYSIS table are available for bulk edit. For example, resp text01 must be enabled in both Analysis and RFQ Response tables, ipn text01 must be enabled in both Analysis and AML.Items tables to be editable. The attributes will only be updated when the attributes are applicable to the row. For example, item flex attributes will only be applied to item rows and will not have effects on manufacturer rows. Response flex attributes will only be applied when there are suppliers associated with the item. |