14 Logging
Logging Overview
- What is a System Report?
-
Jobs and intelligent devices (those with onboard processors) generate system reports when a potential fault has occurred. The library evaluates the information in the system report and attempts to recover from the issue. If the library cannot resolve the issue, it creates a fault report, support bundle, and notification (email, SNMP, outbound SCI, or ASR).
After a job or device generates a system report, the library attempts to recover. The library will either initiate a recovery job or initiate handling of the fault. A typical recovery job will:
-
Perform one or more diagnosis tests
-
Generate a suspect FRU list and create a final system report indicating the failed device (if a failed FRU is identified)
-
Log the status of the diagnosis
-
- What is a Fault Report?
-
If the library cannot recover from an issue indicated in a system report, it generates a fault report. The report lists the faulted device and log information. Faults also generate a support bundle and notifications (email, SNMP, outbound SCI, ASR).
- What is a Support Bundle?
-
Support bundles contain encrypted log files and database information used for fault diagnosis by Oracle service personnel. The library automatically generates a support bundle when it detects a fault.
Fault Example
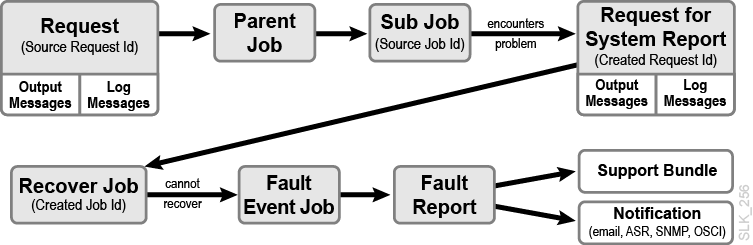
In this example, an external client (such as the GUI) creates a request. That request creates a parent job, which creates a sub job. The sub job encounters an issue and submits a request for a system report. The system report generates a recovery job. When the recovery job is unsuccessful, it creates a fault event job which creates a fault report. The fault then generates a support bundle and sends out notifications to any destination registered to receive the fault event category (see "Alerting Event Categories").
The initial request is the "source request", and the sub job that encountered the issue is the "source job". The request submitted by the sub job to create the system report is the "created request". The recovery job is the "created job". Depending on the actions taken by the library to complete the requests, the details about the request may contain output messages and log messages.
View a System Report
-
Click Reports in the left navigation area of the GUI.
-
Click the System Reports tab.
-
Select a report in the table. Use the Actions drop-down (or right-click menu) to view additional information.
-
Source Request Details — information about the request that spawned the problematic job. If the issue was not a direct result of a request (such as a sudden device failure), there will be no source request or source job information.
-
Source Job Details— information about the job that encountered the issue.
-
Created Request Details — information about the request made by the problematic job or intelligent device to generate the system report. Every system report will have a created request Id.
-
Created Job Details — in some cases, the generation of a system report may create a job to recover from the issue. The created Job Details contains information about the job that was spawned by the system report.
Some Request Details pages will contain additional tabs that you can use to view more information about the issue.
-
Output Messages - the list of request messages generated as the library processed the request
-
Log Messages - (selected roles only) log messages that references the request.
-
View a Fault Report
-
Click Reports in the left navigation area of the GUI.
-
Click the Fault Reports tab.
-
Select a report in the table. Use the Actions drop-down (or right-click menu) to view properties, view the corresponding system report properties, mark as reviewed, or download the corresponding support bundle.
View or Download a Library Log
-
Click Service in the left navigation area of the GUI.
-
Click the Library Logs tab.
-
Select the starting and ending time for the log. You should select a start and end time around a specific event. Enter text to search for (optional). Click View Log.
Note:
Viewing hours or days of logs may result in a truncated view and may take multiple minutes to populate. If the GUI viewer truncates the log, download the log to see the entire time period. -
Optionally, click Download Log to save or view the log in an external application. Click Download All Logs to create an encrypted ZIP of all log files that you can send to Oracle support.
Analyzing the Log
The log may contain diagnostic information that you can use for troubleshooting. The easiest way to analyze the log is to download and open it in a searchable text viewer.
Use the GUI's system reports, fault reports, or jobs page to identify the date/time and deviceId, jobId, or requestId relating to the issue. Then, search the log for that ID. For example, if the GUI indicates the library rail is inoperative and the rail has a deviceId of 38, you might search for "deviceId: 38" and review any log entry relating to that device for clues on the issue.
A log message or support bundle was there previously, where did it go?
To prevent running out of storage space on the disk drive, the library rotates (overwrites) older logs, storing a maximum of 500MB of diagnostic log data. Due to log rotation, some request and job details may no longer have a log messages tab. Similarly, the library keeps the latest ten supports bundles and then removes the oldest once a new one is created. You should copy or download any log information or support bundles as soon after an event as possible.