11 Operating and Managing the Library
View the State of the Library, Devices, and Partitions in the Status Bar
The status bar, located near the top of the GUI screen, displays the current library state and the number of devices and partitions in each state. The overall library state automatically updates based on the status of devices within the library.
Note:
Clicking the library state in the status bar displays the current Library Condition Indicators and notes any offline or inoperative devices.-
Starting Up — the library will be in this state immediately after powering on or restarted. The library is waiting for devices to "announce" their presence. If the library remains in "Starting Up" state for more than a few minutes, click the library state to see what the library is waiting for.
-
Initializing
 — the library is initializing the robots.
 -
Operative
 — the library is fully operational.
 -
Operative, Partially Online — the library is operational, but some devices are in an offline state. Click the "Operative, Partially Online" status for a list of offline devices.
-
Degraded
 — a device in the library has failed or is offline, but the library can continue to function.
 -
Inoperative
 — a device has failed and the library cannot function (such as a failed robot in a single robot configuration).
Device Status — In the status bar, clicking the device count adjacent to the indicator takes you to the hardware device tree (see "View Hardware Device Status"). The device counts in the status bar include all devices but not modules, while the device counts in the device tree include modules. Therefore, the device counts in the status bar and device tree will differ slightly.
Partition Status — In the status bar, clicking any of the partition counts takes you to the partition page (see "Partitioning the Library") where you can filter or sort by control or operational state.
Status Indicators:
-
Operative
— the device/partition is operating properly. A device is operative if the library can fully use the device, its control state is online, and its operational state is operative. -
Offline
 — the device/partition is in the offline control state.
 -
Degraded
 — a device/partition has failed, but the library can continue to function.
 -
Inoperative
 — a device/partition has failed causing the library to not function.
Locate a Failed Device
If the library is "Partially Online", "Degraded", or "Inoperative", click the library state in the status bar to view offline or failed devices. Or, click Hardware, followed by the Device Status tab, and then click the Faulted Devices tab to identify which device is causing the state.
View the Cell Map
You can use the cell map to view the current location of tapes and drives in the library.
-
Click Library in the left navigation area of the GUI.
-
Click a module. A green arrow
 indicates the currently selected module.
 -
Hover over a cell to view the cell address, partition assignment, tape type, and so on. Click a cell to view more options:
View Hardware Device Status
You can display status information for all devices in the library.
-
Click Hardware in the left navigation area of the GUI.
-
Select a tab:
-
Device Status Tree tab - shows a hierarchal device tree for all devices in the library. The library cannot populate the device tree while in "Starting Up" state. Select a viewing option for the device tree:
-
All Devices button - shows all installed devices (default view)
-
Faulted Devices button - shows only the devices in a troubled state
-
All Locations button - shows all installed devices, plus empty location where a device could be installed (for example an unoccupied drive bay)
TIP:
Right-click in the device tree, and then use "Collapse", "Collapse All Below", "Expand", or "Expand All Below" to view specific portions of the device hierarchy. -
-
All other tabs - show devices of that type in table format. These tabs may be incomplete if the library is in "Starting Up" state.
-
View the Inside of the Library Using the Web Camera
The web camera is an optional feature installed on the inside of a Base or Drive Modules used to view library operations. This can be useful to view the tape drives without opening the library door.
-
Click Hardware in the left-navigation area of the GUI.
-
Click the Cameras tabs.
Note:
If library contains cameras but they are not showing up in the list, from the Actions drop-down select Detect Cameras. -
Select the camera from the list, and then use the Actions drop-down (or right-click menu) to select View
 .
. -
Use the arrow buttons
 to move the camera's field of view or click Reset to center the camera straight forward.
View Library Requests, Jobs, and Resources
Every external command to the library (SCSI, SCI, GUI, SNMP, GET) and many internal actions will result in a request. You can use the Requests page to monitor the requests to the library. As the library executes requests, it generates "request output messages" which describe the actions taken by the library or any errors encountered. You can view theses messages in the GUI.
Some library requests generate jobs. For example, moving a tape from one cell to another would generate a parent "Move" job and two sub-jobs: "Fetch" and "Put". Jobs allocate cells, devices (robots, drives, and so on), and rail segments. Only one job at a time can use each resource. Use the Jobs and Resources page to monitor library activity.
-
Click Activity in the left navigation area of the GUI.
-
Click the Requests tab, Jobs tab, or the Resources tab.
-
To view more information: Select a row in the table, and then from the Actions drop-down (or right-click menu), select Details.
For Requests, the Details screen shows several tabs:
-
Details - summary of detailed information about the request.
-
Output Messages - the list of request messages generated as the library processed the request
-
Log Messages - (selected roles only) log message that references the request.
For Jobs, you can select Request Details to view information about the parent request that spawned the job. If a Download button is present, then you can save the entire Details or open it in an application.
-
-
To only view active requests or jobs, filter for 'Active' in the Status column ("Search and Sort Tables").
Cancel a Library Request
Note:
You can only cancel requests that are "Active" or "Submitted".-
Click Activity in the left navigation area of the GUI.
-
Click the Requests tab or the Jobs tab.
-
Select the request or job. From the Actions drop-down (or right-click menu), select Request Cancel (for requests) or Cancel Parent Request (for jobs).
TIP:
To cancel multiple requests: ctrl-click or shift-click to select the requests, and then from the Actions drop-down (or right-click menu), select Request Cancel/Cancel Parent Request.
Cancellation is Not Immediate
After you cancel a request, the library completes all in-progress robot operations and attempts to leave itself in a consistent state. For in-progress moves, the library returns the tape to the source cell, if possible. For canceled diagnostic tests, the library attempts to return the tape to the cell it started in before the diagnostic began.
View a List of All Cells in the Library
-
Click Cells/Tapes in the left navigation area of the GUI.
-
Click the All Cells tab.
View the SCSI Element IDs
Hover over a cell on the cell map (see "View the Cell Map"), or view the drive table or cell table "SCSI element ID" column (see "View Drive Information" and "View a List of All Cells in the Library").
View Firmware Levels
The library and devices contain firmware. You can view the current firmware version and build date.
View Device Firmware
-
Click Firmware in the left navigation area of the GUI.
-
Click one of the following tabs:
-
Available Device Firmware - shows the device firmware that was delivered as part of the library firmware image.
-
Reported Device Firmware - shows the firmware that the devices themselves report. This firmware may or may not be the same version as what is shown on the Available table since some devices may be blocked from receiving upgrades (see "Block, Allow, or Force Device Firmware Upgrades").
-
View Library Firmware
-
Click Firmware in the left navigation area of the GUI.
-
Click the Library Firmware tab.
View a Graph of Device Telemetry Data
Some devices in the library periodically collect time-stamped measurements. Using the GUI, you can view a graph of the telemetry data.
-
Click Hardware in the left-navigation area of the GUI.
-
Select a device from the device tree. You can view telemetry for the following:
-
Library Controller
-
Robot
-
Drive
-
Root Switch
-
Drive Switch
-
Fan assembly
-
DC power controller
-
-
Use the Actions drop-down (or right-click menu) to select Device Telemetry, and then select a type of measurement.
-
By default, the graph shows the past three days of telemetry data. Adjust this time span by clicking the buttons above the graph.
-
For further analysis of telemetry data, you can download the graph's source data in CSV format, and then import the data into a graphing application of your choice.
Types of Telemetry Measurements
Telemetry data can be a running total (such as robot and CAP operational data) or show an instantaneous value for a point in time (such as temperature or fan speed). Running totals reset after each library startup. The following describes the device data collected.
Robot Measurements
-
Gets - running total of gets performed by robot
-
Get Retries - running total of retries performed during gets
-
Failures - running total of failures during gets
-
Puts - running total of puts performed by robot
-
Put Retries - running total of retries performed during puts
-
Put Failures - running total of failures during puts
CAP Measurements
The library collects CAP measurements for both rotational and Access Module CAPs.
-
Operations - running total of open and close operations performed by CAP
-
Retries - running total of retries
-
Unrecoverable Errors - running total of unrecoverable errors for the CAP (typically zero or one because an unrecoverable error requires replacement)
-
Reboots - running total of CAP restarts (typically just one at library startup, but this can be higher if you replace the CAP controller card while the library is running)
Library Energy Measurements
Each PDU in the library has a single sensor that collects the energy draw and energy consumption for the PDU. Total power consumption is the sum of all PDU energy usage in the library.
-
Kilowatts - average power draw over measurement period, in KW
-
Kilowatt hours - energy consumption over measurement period, in KW-hours
-
Duration - measurement period
Device Power Measurements
Some devices contain "hot swap controller chips" that collect the energy draw and energy consumption for the device and any downstream components.
-
Input Voltage - input DC voltage to the device in volts.
-
Watts - power draw in watts at the time of measurement
-
Input Amps - input current to the device in amps.
Devices monitored in the Base card cage:
-
Library controllers
-
Feature cards
-
Root switches, which each have a 12V input sensor and a 48V power sensor for the web camera
-
Fan assemblies
-
Storage hard drives
-
Video card
Robot-related devices monitored:
-
Rail controller, which has an input sensor to the rail controller and an input sensor to the rail
-
Robot controller, which captures input to the robot controller and robot, including all mechanical mechanisms
Drive-related devices monitored:
-
Drive switches
-
Drive controller which captures input to the drive tray (including power for the drive controller, fans in the drive tray, tape drive and encryption card, if present)
Access Module devices monitored:
-
Access module controllers which capture the input to the Access Module (including power for access module controller and the mechanical mechanisms in the module)
Other devices monitored:
-
Rotational CAPs (rotary)
Network Statistics Measurements
Ethernet switches and some device controllers in the library collect a running total of network performance data. The root and drive switches collect data infrequently due to the high number of ports, about every 10 to 20 minutes. The rail, robot, drive, and Access Module controllers collect data every few minutes. Each device has multiple sensors that represent the network ports on that device that link to another device. The sensor names reflect the destination of the link.
-
Port Speed - speed at which the port is running.
-
Transmit Bytes – bytes transmitted by the port.
-
TX Dropped Packets – transmit packets dropped by the port due to lack of resources or internal MAC sublayer transmit error.
-
TX Collisions – collisions experienced by a port during packet transmissions.
-
TX Pause Events – PAUSE packets transmitted on the port.
-
Receive Bytes – bytes of data received by the port.
-
RX Dropped Packets – packets received by a port that were dropped due to lack of resources. This increments only if the receive error was not counted by the RX Alignment Errors or the RX FCS Errors counters.
-
RX Pause Frames – PAUSE packets received by a port.
-
RX Alignment Errors – packets received by a port that have a bad FCS with a nonintegral number of bytes.
-
RX FCS Errors – packets received by a port that have a bad FCS with an integral number of bytes.
-
RX Symbol Errors – Number of times a valid length packet was received at a port and at least one invalid data symbol was detected.
Devices that record network statistics:
-
Access Module controller
-
Drive controller
-
Drive switch
-
Rail controller
-
Robot controller
-
Root switch
Fan Measurements
-
Performance - an overall assessment of the fan's health based on comparing the measured fan speed to the expected speed. The actual speed may be higher or lower than the expected speed.
-
GOOD — measured speed is within 15% of the expected speed.
-
MARGINAL — measured speed is between 15% and 20% of the expected speed.
-
POOR — measured speed is more than 20% away from the expected speed.
-
UNSTABLE — the fan speed cannot be measured accurately
-
NO_READING — the fan performance cannot be determined at the time of the measurement.
-
-
Speed - actual fan speed in RPM at the time of the measurement
Devices that record fan measurements:
-
Drive controller (up to three fans, depending on drive type)
-
Fan assembly (four fans)
Set the Control State of a Device Online or Offline
An offline device is unavailable to hosts. You should take a device offline before removing it from the library.
-
Click Hardware in the left navigation area of the GUI. Locate the device in the device tree.
-
Select the device and then from the Actions drop-down (or right-click menu) select Control State, and then click Go Online or Go Offline.
Note:
Some devices (such as drives and robots) will complete in-process jobs before going offline. When this occurs, the GUI indicates "offline pending" for the device.
What's the Difference Between Control State and Location State?
The control state indicates the current online or offline state of the device. The location state (either Bring Online or Keep Offline) determines whether the library should bring the device in that slot online when you insert a new device or when the library powers on.
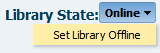
Set the Library Online or Offline
An offline library is unavailable to hosts, therefore taking the library offline is disruptive to host operations. You should stop any host activity before taking the library offline.
-
Click Online or Offline in the upper right corner of the GUI.
-
Change the library state.
Note:
If there are jobs in-process when you take the library offline, the library will remain in a "going offline" state until it completes the jobs, and then transition to "offline".
Turn Off the Library
Note:
Powering down the library will interrupt all host jobs. If you shut off power to the library without performing the following procedure, you risk possible equipment damage, tape damage, and loss of data.-
Stop any host activity. Ensure all library requests have completed (see "View Library Requests, Jobs, and Resources").
-
Click the power button
 in the upper left of the GUI.
 -
Select Power Down Library.
-
Optionally, select settings "Bypass audit" or "Probe for configuration" when the library turns on (for a description of these options, see "Library Settings Options")
Note:
You must select "Probe for configuration changes" if you plan to add or remove modules, drive arrays, or CAPs. -
Click Power Down. The library operator panel will go black once the power down sequence completes.
-
Open the back doors of the Base Module (and any Drive Modules if present).
-
Turn off the breaker on each PDU.
Turn On the Library
Once you turn on the library, the initialization sequence will begin. If someone opened an access door while the library was off, the library performs a full audit (unless you selected bypass audit in the library settings, see "Library Settings Options").
-
Open the rear doors of the Base Module (and any Drive Modules if present).
-
Turn on the breaker for each PDU.
-
If necessary, turn on the rail controller modules at the top of the Base module.
Note:
You can turn on the PDU and rail controller breakers in any order. However, you must turn on all breakers within two minutes of turning on the first breaker.
-
Rail controller modules
-
Restart the Library or Reboot Library Operating System
-
Restart the Library — completely stops and restarts the library controller.
-
Reboot Library OS — only restarts the operating system, it does not completely restart all library systems. This option generally takes a shorter amount of time.
Neither option power cycles the library. To power cycle, you must manually flip the PDU switches.
-
Click the power button
in the upper left of the GUI. -
Select Restart Library or Reboot Library OS.
Note:
If you bypass the audit, the contents of the library must not change. The library will not perform an audit when it initializes. -
Click Restart.
-
You will be logged out of the GUI, wait until the library initializes to log back in.
Audit All or Part of the Library
An audit verifies cell contents and updates the library database, which contains the volume ID (volser), current location, and verified status for each tape. The library automatically performs a full library audit after a front access door closes (excluding the Access Module door when used as a CAP) or after the library initializes (unless you select bypass audit in the "Library Settings Options").
-
Click Cells/Tapes in the left navigation area of the GUI.
-
From the Actions drop-down (or right-click menu), select Audit.
-
Select the starting and ending address. Select the cell types to audit.
To run a full library audit, select the following values:
-
Starting Address
-
Column: smallest value available (most likely the most negative value)
-
Side: Back
-
Row: 1
-
-
Ending Address
-
Column: highest positive value available
-
Side: Front
-
Row: 52
-
-
Cell Types: All
-