Library System Analysis
Analyze resource errors, trends, and identify total types of resources within your system.
-
Display Correlations Between the Drives and Media with the Most Errors
-
Determine Number of Libraries, Drives, or Media in the System
Identify Media and Drives Involved with Job Errors
Add a filter to the Exchanges Overview screen to identify drives and media involved with an error.
This procedure can help addresses the questions such as, "At 9:00 am today, one of our tape jobs experienced an error. Which drive and media were involved? Have they also experienced other errors?"
In cases where each "job" is an independent exchange (that is, mount, read/write data, dismount), you can use this method to access information about tape job failures.
-
In the left navigation, expand Tape System Activity, select Exchanges Overview.
-
To view more of the table, click Collapse Pane
 in the middle of the screen (see Resize or Collapse Areas of the Screen).
 -
Add a filter to narrow down the data to just exchanges that experienced errors:
-
Click Filter Data
 .
. -
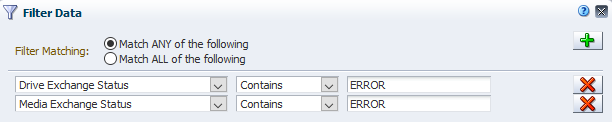
In the Filter Matching field, select Match ANY entered criteria.
-
Add selection criteria:
-
Drive Exchange Status, Contains, ERROR
-
Media Exchange Status, Contains, ERROR
Entries are not case-sensitive, so "ERROR" will match "error" or "Error".
-
-
Click Apply.
-
-
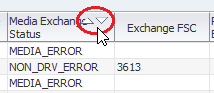
Scroll to the exchanges that occurred during the time in questions, and review the information in the Drive Exchange Status, Media Exchange Status, and Exchange FSC columns for details about the errors.
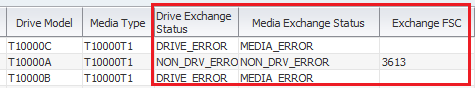
Description of the illustration ''exchange_errors.png''
Note:
The Drive Health Indicator and Media Health Indicator columns may indicate Use even after an error. This is because the values of these attributes are aggregated over time. The specific values depend on the frequency and severity of errors, and whether there have been subsequent exchanges with no problems. Recent exchanges with no problems move the aggregated value toward a "Use" status. -
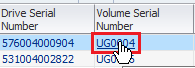
Optionally, to display detail about a drive or media involved in an error, select the text link in either the Drive Serial Number or Volume Serial Number column.
Display Correlations Between the Drives and Media with the Most Errors
Determine if there is a correlation between the drives and media with the most errors. This may help identify problematic drives and media.
Identify drives and media with the most errors to address the questions, "Which drives and media have had the most errors in the last 30 days? Are there any correlations between the two?"
-
In the left navigation, expand Tape System Activity, select Exchanges Overview.
-
Filter the data to display only those exchanges within the last 30 days and that involve the drive with the most errors (identified in Identify Drives With the Most Errors).
-
Click Filter Data
. -
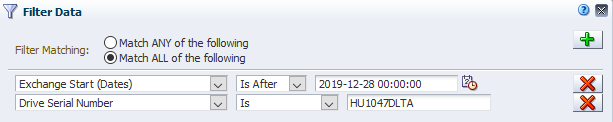
Select Match ALL entered criteria.
-
Add the filter criteria:
-
Exchange Start (Dates), Is After, a date 30 days ago
-
Drive Serial Number, Is, serial number of the drive with the most errors
-
-
Click Apply.
-
-
To focus on the media involved in the errors, sort the table by a related column (such as Media Exchange Status, Exchange FSC, or Media Health Indicator).
-
Look at the Volume Serial Number column to see if there are any correlations between drive errors and specific media.
-
If you do find a potential correlation, filter the data further to display just the exchanges that involve both the faulty drive and the suspect media.
-
Click Filter Data
. -
Leave the current criteria rows as is, but add:
-
Volume Serial Number, Is, the volser of the suspect media

-
-
Click Apply.
-
Determine Number of Libraries, Drives, or Media in the System
Use the Dashboard, Overview, or Analysis screens to determine how many libraries, drives, or media are in your tape system environment.
Hover Over Dashboard Items to View Resource Totals
-
In the left navigation, expand Home, then select Dashboard.
-
Use the Library Status, Library Media Slots, and Library Drive Bays to view total for various types of resources.
-
Hover over an item to get a count for the particular resource.
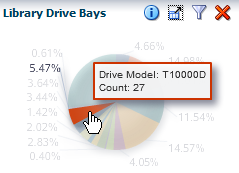
-
Optionally, click a section of the chart to link to the Overview screen for that resource.
Use Record Totals within Overview Tables to Get Total Resources
-
In the left navigation, expand Tape System Hardware, select an overview (such as Drives Overview).
-
Click Reset Filter
 to removal all filtering and view totals for the entire system.
 -
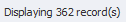
In the lower-right of the table, the number of records indicates the total number of resources (such as drives).
Use the Analysis Screen to View an Aggregated Total
-
In the left navigation, expand Tape System Hardware, select an analysis screen (such as Drives Analysis).
-
Click Reset Filter
to removal all filtering and view totals for the entire system. -
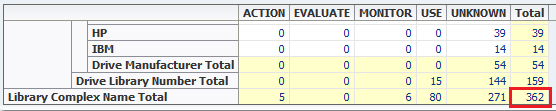
The value in the bottom-right of the pivot table shows the total for the system.
Report Library Activity Levels
Identify which library in your environment is the busiest. This may be helpful to determine how to reallocate resources.
This procedure addresses the questions, "Which library in my tape environment is the busiest? Which is the least busy?" The definition of busy varies by site; common definitions include the number of exchanges, mounts, or dismounts. This procedure uses the number of mounts. In addition, it provides instructions for graphing the data so you can compare the libraries to one another and to the system average.
-
In the left navigation, expand Tape System Hardware, select Libraries Overview.
-
In the Templates menu, select "STA-Lib-Utilization".
-
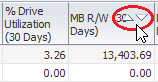
Click Sort Ascending or Sort Descending for one of the following columns: Mounts (30 Days), CAP Enters (30 Days), CAP Ejects (30 Days), Occupied Storage Cells, or MB R/W (30 Days).
-
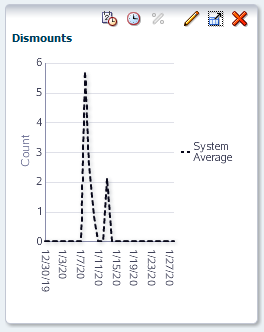
Add a graph pane showing dismounts.
-
Click Add Graph
 .
. -
Within the graph's toolbar, click Change Graphed Attribute
 and select Dismounts.
 -
The graph is updated to display the system average for dismount data.
-
-
Add selected libraries to the graph to compare to the system average.
-
In the table, select the libraries you want to add to the graphs.
-
Click the Apply Selection
 .
.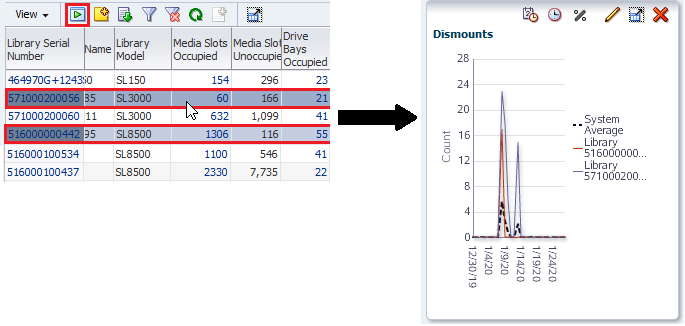
Description of the illustration ''compare_system_avg.png''
-