Drive Analysis
Identify problematic drives, analyze error and efficiency trends, and check drive firmware levels.
Identify Drives With the Most Errors
A high number of errors may indicate a problematic drive. Identify the drives that have had the most errors recently to see if their error rates have changed to answer questions such as, "Which drives have had the most errors this week? Have their error rates gone up?"
-
In the left navigation, expand Tape System Hardware, then select Drives Overview.
-
In the Templates drop-down, select "STA-Drive-Health".
-
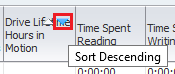
In the Dismounts with Errors (30 Days) column, click the Sort Descending
 arrow. The drives with the most errors are brought to the top of the list.
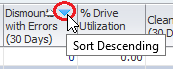
-
Add drives to the graphs to compare their attributes against the system average.
-
Select the drives you want to add to the graphs (shift- or ctrl-click to select multiples).
-
Click Apply Selection
 .
.The graphs are updated with the drive data. In the example below, one of the drives shows a high level of errors when compared with the system average.
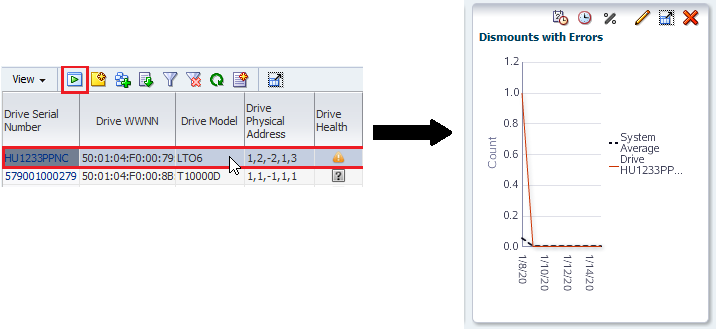
Description of the illustration ''compare_sys_avg_drive.png''
-
-
Narrow down the date range on the Drive Errors graph pane.
-
Click Choose Date Range
 on the graph's toolbar.
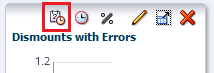
-
Complete the Choose Date Range dialog box as follows:
-
Select Time Range.
-
In the Starting Date and Ending Date fields, enter the start and end dates of the current week.
-
-
Click OK.
The graph will update with the new time period. Variations in the graph lines should show increases and decreases in error rates during the week.
-
Analyze Drive Failure Trends
This procedure addresses the question, "Is the drive that failed twice today the same one that caused problems two months ago?"
-
In the left navigation, expand Tape System Activity, select Exchanges Overview.
-
To view more of the table, click Collapse Pane
 in the middle of the screen (see Resize or Collapse Areas of the Screen).
 -
Add a filter to narrow down the data to exchanges from four and five months ago involving the suspect drive.
-
Click Filter Data
 .
. -
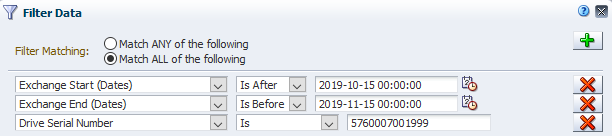
Select Match ALL entered criteria.
-
Add the following selection criteria:
-
Exchange Start (Dates), Is After, a date three months ago
-
Exchange End (Dates), Is Before, a date two months ago
-
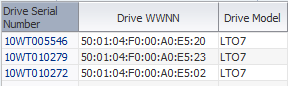
Drive Serial Number, Is, the serial number of the drive with errors
If your site has exchanges that last more than a day, you may need to adjust your date settings to encompass complete exchanges involving the drive in question.
-
-
Click Apply.
-
-
Visually scan the data to determine whether the drive experienced exchanges with errors during this period.
Identify Drives that had a Health State Change
Get a quick snapshot of drives whose health state have changed.
-
In the left navigation, expand Tape System Hardware, select Drives Messages.
-
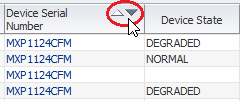
In the Device Serial Number column, click the Sort Ascending or Sort Descending arrow. Errors and statuses are grouped by drive.
-
Visually scan the list for changes in the device state of individual drives.
Analyze Drive Efficiency
STA collects read and write rates per exchange and then summarizes them into daily and 30-day time periods to help answer the question, "Which drives have had significantly change in efficiency over time?"
-
In the left navigation, expand Tape System Hardware, select Drives Overview.
-
In the Templates menu, apply the "STA-Drive-Performance-30-Days".
This does not include any graph panes. Some values may be null if STA has not been monitoring a drive long enough to gather data.
-
Add graphs to see changes in efficiency over time.
-
Click Add Graph
 . STA displays a new graph with the attribute MB Read.
 -
Within the graph's toolbar, click Change Graphed Attribute
 and select an attribute of interest (such as Avg Mount Read MB/sec).
 -
Repeat to add multiple graphs.
-
Add specific drives to the graphs to compare them against the system average.
-
Select specific drives in the table (shift- or ctrl-click to select multiples).
-
Click Apply Selection
. The graphs update with the drive specific data.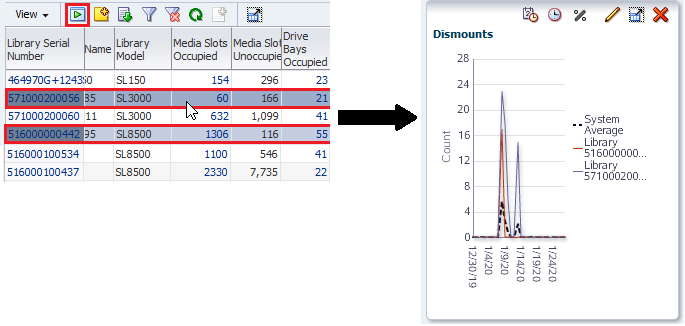
Description of the illustration ''compare_system_avg.png''
-
Analyze Drive Utilization
Analyze drive utilization to address the question, "Which drives are used the most?" Utilization can be defined in several ways, including lifetime hours in use, amount of data passed, and total number of mounts.
-
In the left navigation, select Tape System Hardware, select Drives Overview.
-
In the Templates menu, select "STA-Drive-Utilization".
-
Use either of these columns to analyze drive use:
-
Drive Lifetime Hours in Motion (enterprise drives only)
-
% Drive Utilization (30 Days
-
-
In the corresponding column, click the Sort Descending arrow. The most used drives are brought to the top of the table.
-
Add the top five drives to the graph to compare their attribute values against the system average.
-
In the table, select the top five drives.
-
Click the Apply Selection
to add the drives to the graphs.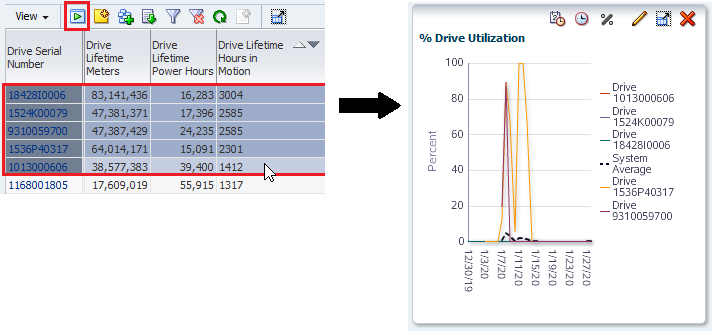
Description of the illustration ''compare_sys_avg_util.png''
-
-
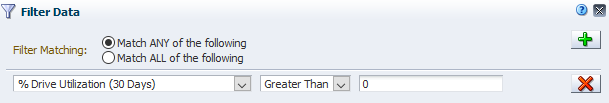
Filter the data to hide drives for which STA has no utilization data.
-
Click Filter Data
. -
Add one of the following criteria that represents a utilization measure of interest to you.
-
To identify drives with the highest utilization rates, use:
% Utilization (30 Days), Greater Than, 0. -
To identify drives that have recorded the most new data, use:
MB Write (30 Days), or MB Received (30 Days), Greater Than, 0. -
To identify drives that have passed the most data at the drive head, use:
MB R/W (30 Days), Greater Than, 0. -
For drives that have been in the library for their entire periods of use:
Drive Lifetime Loads or Drive Lifetime Hours in Motion, Greater Than, 0.
-
-
Click Apply.
-
-
Sort the data by drive type and then utilization. From the View drop-down, select Sort, and then Advanced...
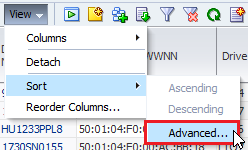
-
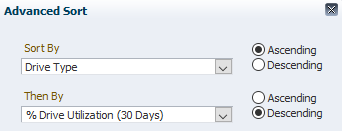
In the Sort By field, select Drive Type.
-
In the Then By field, select the attribute that you used in Step b above, and Descending.
-
Click OK.
-
-
Use an external spreadsheet application to calculate the total capacity and space available for each media type.
-
Click Export
 and select Drives.xls (see Export Table Data to a Spreadsheet or Document for more information).
 -
Save the file to a location on your local computer.
-
Open the file in a spreadsheet application and summarize the data. For example, you may want to calculate totals, percentages used, or averages by media type.
-
Report Drive Firmware Levels
Identify drive firmware levels to address the question, "Have all my drives been upgraded to the latest firmware?"
-
In the left navigation, expand Tape System Hardware, select Drives Analysis.
-
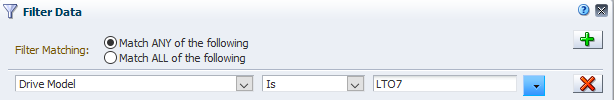
Filter the table to display firmware levels for a specific drive model.
-
Click Filter Data
. -
Add the criteria: Drive Model, Is, drive model
-
Click Apply.
-
-
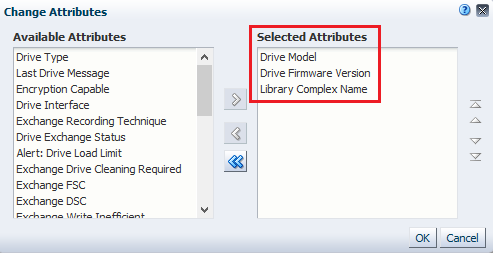
Reorganize the pivot table to aggregate firmware levels by drive model.
-
Above the table, click Change Attribute
. -
Rearrange the attributes so the Selected Attributes list is as follows:
-
Drive Model
-
Drive Firmware Version
-
Library Complex Name
-
-
Click OK.
-
-
To display a detailed listing of any of the subtotals, click the text link in a cell.
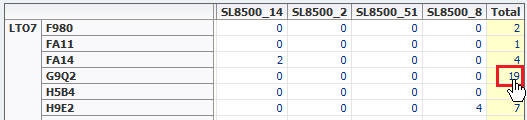
You are taken to the Drives – Overview screen, which displays additional detail for the drives included in the selected subtotal.