General Error Trend Analysis
Find trends in errors to better analyze your library system.
View Error Messages From a Specific Time
Check for error messages during a specific time period to help you answer questions such as "What critical errors were reported to STA last month?".
-
In the left navigation, expand Tape System Activity, select All Messages Overview.
-
Add a filter to narrow down the data to just traps that involved errors:
-
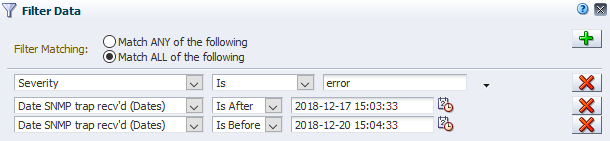
Click Filter Data
 .
. -
Select Match ALL entered criteria.
-
Add the following criteria:
-
Severity | Is | Error
-
Date SNMP trap recv'd (Dates) | Is After | select starting date
-
Date SNMP trap recv'd (Dates) | Is Before | select ending date
-
-
Click Apply.
-
-
Review the errors during the time period.
View Trends in Critical Drive and Media Errors
Drive and media errors result from exchanges. Therefore, use the Exchanges Overview screen for a consolidated view of errors to answer the question "Is the total number of errors trending up, down, or staying stable?".
-
In the left navigation, select Tape System Activity, select Exchanges Overview.
-
In the Templates menu, select the "STA-Exchanges-Alerts-All" (or "STA-Exchanges-Alerts-Errors" for a smaller subset).
-
The template includes several columns that indicate different types of errors. Review the errors listed.
-
If there are enough errors to indicate possible trends, add graphs of interest to the Graph Area:
-
Click Add Graph
 . STA displays a new graph with the attribute MB Read.
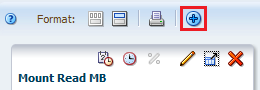
-
Within the graph's toolbar, click Change Graphed Attribute
 and select an attribute of interest.
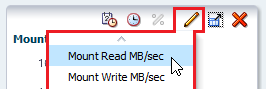
-
Repeat to add multiple graphs (such as Write Efficiency, Read Margin, and R/W Rate MB/sec).
-
Use an external spreadsheet application to calculate total errors by error type.
-
Click the Export
 and select Exchange.xls (see Export Table Data to a Spreadsheet or Document for more information).
 -
Save the file to a location on your local computer.
-
Use a spreadsheet application to open the file and summarize the data.
-
View Trends in Exchange Errors
View exchange errors for the last week to address the questions: "Which drives have had the most errors this week? Have their error rates gone up?"
-
In the left navigation, expand Tape System Activity, select Exchanges Overview.
-
In the Templates menu, apply the "STA-Exchange-Alerts-Errors" template.
-
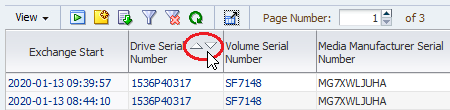
In the Drive Serial Number column, click Sort Ascending or Sort Descending.
-
To focus on specific errors, move columns around and remove empty columns (see Reorder Columns and Hide and Reveal Columns).
-
Add a filter to display just this week's data:
-
Click Filter Data
. -
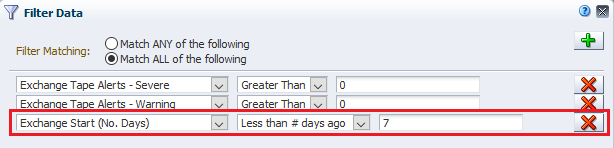
In the Filter Matching field, select Match ALL entered criteria.
-
Add the criteria: Exchange Start (No. Days) |Less than # days ago | 7
-
Click Apply.
-