Display Aggregated Drive Data
Analysis screens show aggregated data for library components or events using a pivot table. You can modify the table to organize data into categories of your choice.
Pivot tables can help you see patterns and trends that you otherwise might not see in a standard table. Use the following steps to display aggregated drive data and the underlying details.
-
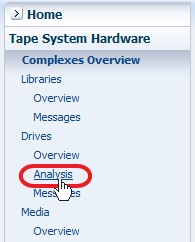
In the left navigation, select Drives Analysis.
The Drives – Analysis screen has a graph area at the top and a pivot table at the bottom. The example below shows the STA-Default template for the Drives – Analysis screen. The pivot table aggregates drive health data by library complex, library ID, and drive manufacturer.
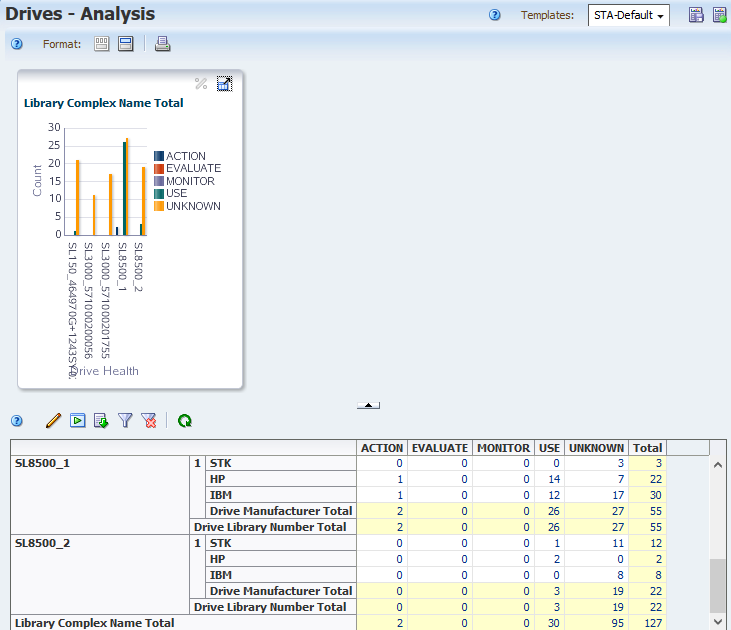
-
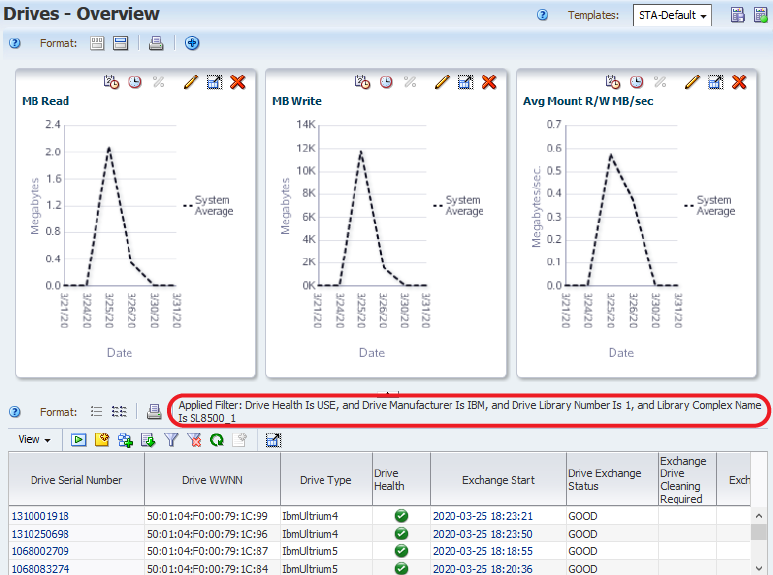
The values in the pivot table are active links. Click a link to see details for the aggregated number.
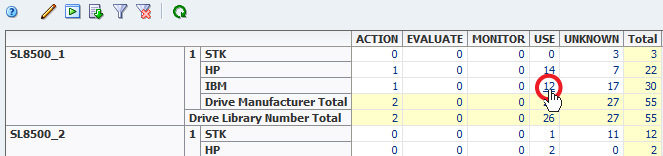
The link takes you to the Drive-Overview page with a filter applied that shows the selected values from the pivot table.