Using the OrgChart Class
Use the OrgChart class to create organization charts. An organization chart represents hierarchical data as boxes arrayed in levels, which can be oriented top to bottom, with horizontal rows, or left to right, with vertical rows. Connectors show parent and child relationships between boxes on adjacent levels.
You can use this chart type to display many different types of hierarchical relationships, including, but not limited to:
People in organizations
Positions in organizations
Departments in organizations
Components in bills of materials
This section provides an overview of organization chart terminology and discusses how to use the OrgChart Class.
Organization charts can be composed of many different elements, such as the main chart, nodes, connectors, pop-up nodes, and so on. These terms apply specifically to organization charts:
|
Field or Control |
Definition |
|---|---|
| Breadcrumbs |
You can configure an organization chart to optionally display links at the top of an organization chart. Typically, these are the names of people in an organization hierarchy. |
| Child node |
A node that is one level below its parent node (except for the top-level node). Every node except the top-level node has one parent node. |
| Connector |
Lines that link the boxes in an organization chart. Connectors denote parent and child relationships. A connector also shows the relationship between a pop-up node and the predecessor node of the pop-up. |
| Descriptor |
A text string that conveys information about a node. A main chart node has up to seven descriptors by default, and can be configured with up to 99 descriptors. A pop-up node has up to eight descriptors. Each descriptor can have an image associated with it and can be configured as a link. On the main chart, a descriptor can also be configured as an IM presence icon, a related actions menu, or a button that is associated with a drop-down list box. FieldChange PeopleCode associated with a descriptor can invoke a pop-up, change the display characteristics of the chart, and perform other processing logic. |
| Drop-down |
You can configure a descriptor as a link associated with a drop-downmenu or a drop down list box. A drop-down can be linkable or read-only. If the drop-down is linkable, PeopleCode related to the descriptor executes when a user clicks a list item. |
| Header |
Information that appears at the top of a pop-up. |
| Level |
An organization chart is made up of boxes, representing nodes, at different levels. The position of a node in a chart is determined by its parent node (PTPARENT_CHART_ND) and display order (PTND_DISPLAY_ORDER). |
| Main chart |
The primary chart in an organization chart showing individual entities, such as employees, in boxes related to one another hierarchically. A user can invoke PeopleCode that displays a pop-up node by clicking a link in a box, or node, of the main chart or by clicking a link in a pop-up node. |
| Node |
A representation of a single entity, an individual instance of data, in an organization chart. A node is represented as a box with vertical lines connecting it to its parent node and to its child nodes, if any. |
| Node record |
A derived/work record that contains the properties and data values for each node on the main chart. The node record is created using a clone of the PTORGNODE_SBR subrecord. |
| Parent node |
A node that has one or more subordinate nodes, or child nodes, one level below it. Each node can be a parent for other nodes. |
| Pop-up |
A new window that displays information specifically related to a node on the main chart or another pop-up. A pop-up can be invoked from a link on a main chart node or from a link on a pop-up node. FieldChange PeopleCode controls the appearance and content of a pop-up. |
| Pop-up node |
A single instance of data on a pop-up. A pop-up can have one or more nodes, all related to one node of the main chart or one node of another pop-up. |
| Pop-up node record |
A derived/work record that contains the properties and data values for each pop-up node on the main chart. The node record is created using a clone of the PTORGPOPUPNODE_SBR subrecord. |
| Related-actions menu |
You can configure a descriptor as a related actions menu. A user can select a link from a cascading drop down menu that invokes a related action from the related content framework. |
A PeopleSoft organization chart consists of two parts: the main hierarchical chart and pop-ups that enable the user to access additional related data for each node.
An organization chart can be oriented vertically or horizontally. Use the Direction to set the orientation of an organization chart.
Image: Vertically oriented organization chart
The following example shows a vertically oriented organization chart:

Image: Horizontally oriented organization chart
The following example shows a horizontally oriented organization chart:
Main Chart
The main chart can have multiple levels. Each level consists of one or more nodes. Each node represents an individual entity, such as an employee, in the organization. A node has one parent node (except the top-level node, which does not have a parent node) and zero, one, or more child nodes. Each node in the main chart has up to 99 descriptors and each descriptor can be configured as a link or as a button associated with a drop-down list box. Application developers can associate FieldChange PeopleCode with each descriptor link or button associated with a linkable drop-down list box.
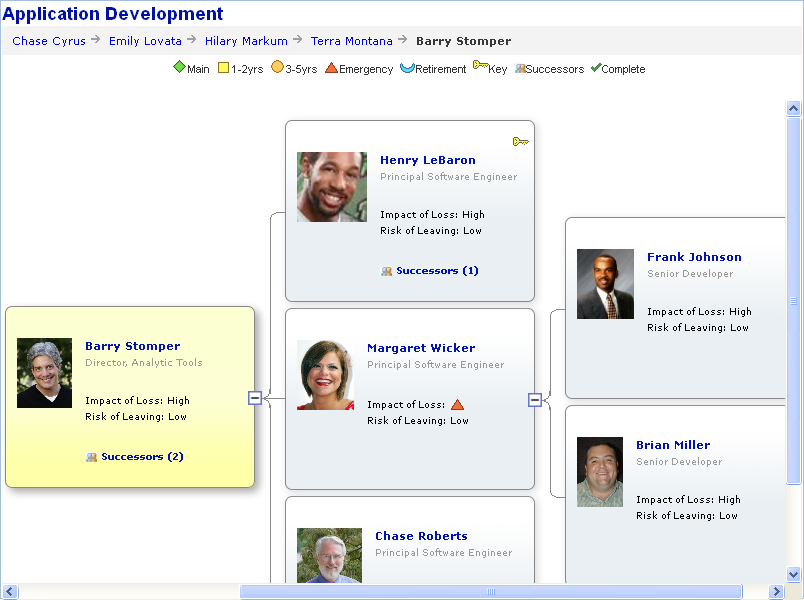
Pop-up Chart
A pop-up displays a pop-up chart with information specifically related to the node from which it was invoked. A connector line visually links the pop-up chart to the predecessor node, the node in the chart from which the pop-up was invoked.
If the pop-up contains more nodes than can be displayed (that is, if MaxPopupDisplayNode is set to a number that is less than the total number of nodes) then a scroll bar appears in the pop-up. In some circumstances when a pop-up has a scroll bar and has more than one level, when a user clicks a link on a level other than the top level the new pop-up may not appear in the display area. If this occurs, the user can scroll down using the scroll bar in the initial pop-up to view the new pop-up node.
Note: The amount of time it takes for a pop-up to appear is proportional to the number of nodes in the pop-up. A pop-up with hundreds of nodes may take a long time to appear. An hourglass appears to let the use know the system is working to retrieve the nodes.
A pop-up is invoked through PeopleCode associated with the FieldChange event for a descriptor link on a main chart node or another pop-up node.
A pop-up consists of a header and one or more nodes with each node having up to eight descriptors. Each descriptor can be configured as a link.
The user can drag-and-drop a pop-up node to reposition it but the new position will not be retained after any action that requires a server trip that reloads the chart.
When you add an organization chart to a page in Application Designer, you use the chart properties to associate the chart control with a chart record field. You will use this field name to identify the chart in PeopleCode.
You will need to create a record that will be the organization chart node record. The organization chart node record holds the values for the properties and data for each of the nodes of the main chart. If your chart uses pop-ups, you will also need a pop-up node record that holds the values for the properties and data for each of the pop-up nodes.
The organization chart node records must be in the component buffer at runtime. This means that you will have to place them on a page at level one in the component. You can hide them.
The maximum number of nodes you can create is limited according to browser, as shown in the following table:
|
Browser |
Maximum Nodes |
|---|---|
|
Google Chrome |
600 |
|
Microsoft Internet Explorer |
250 |
|
Mozilla Firefox |
1000 |
|
Apple Safari |
600 |
The records can have any name, but they must include clones of the PeopleTools-delivered subrecords PTORGNODE_SBR and PTORGPOPUPNODE_SBR. Since the subrecords will carry the FieldChange PeopleCode for the chart, in most cases you should create unique subrecords for each chart.
Your PeopleCode will create and populate two rowsets . These must be component rowsets, linked to the node records of the chart, not standalone rowsets. The organization chart node rowset has one row for each node in the organization chart, and the pop-up node rowset has one row for each pop-up node.
You place FieldChange PeopleCode on the fields of the node records to invoke pop-up charts, update displayed data, process application logic, and refresh the chart.
To create an organization chart you will develop an application that comprises these elements:
A chart page control that displays the chart on a page.
You can place more than one chart control on a page. Each chart control must be associated with a different field.
If more than one pagelet with organization charts appear simultaneously, each chart must be associated with a unique chart record field.
A chart data record, or organization chart node record, based on the PTORGNODE_SBR subrecord, that contains the data for the chart.
A PeopleCode program, usually in the page Activate event, that instantiates the chart, links the chart to the chart control, defines the chart attributes, and populates the chart data rowset.
FieldChange PeopleCode programs associated with the chart data record fields.
Depending on which organization chart features your chart implements, you may need to include these elements in your application:
A pop-up chart data record, based on the PTORGPOPUPNODE_SBR subrecord.
A breadcrumb record, based on the PTORGCRMB_SBR subrecord.
Drop-down list records, based on the PTORGBOXLIST_SBR and PTORGBOXFLD_SBR subrecords.
A node display record, based on the PTNODE_DISP_SBR subrecord.
An IM data record, based on the PTORGIM_SBR subrecord.
Additional PeopleCode to manage the corresponding record data and set attributes for the chart features.
FieldChange PeopleCode programs associated with the corresponding record fields.
The chart data record and all of the records you use to implement organization chart features, such as the pop-up data record, drop down list records, node display record, must be in the component buffer at runtime.
If your application implements zooming, or schema levels, you will need to incorporate PeopleCode to manage the schema levels.
This section presents the steps to create a full-featured organization chart. Some aspects of an organization chart are optional, and not required. The following sections explain how to:
Display breadcrumbs (optional).
Define descriptors.
Configure menus and drop-down lists (optional).
Define drop down lists.
Configure IM presence (optional).
Design organization chart nodes.
Implement zooming (optional).
Configure connector lines and borders.
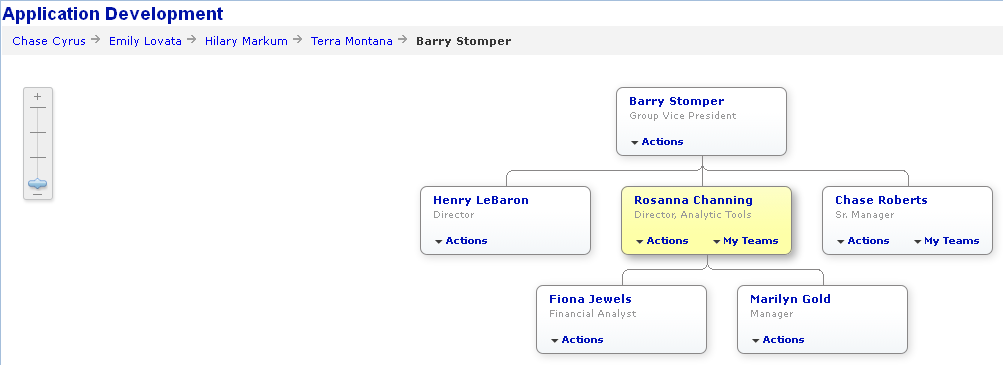
You can configure an organization chart to display breadcrumbs. Typically, breadcrumbs display the names of people in an organization hierarchy.
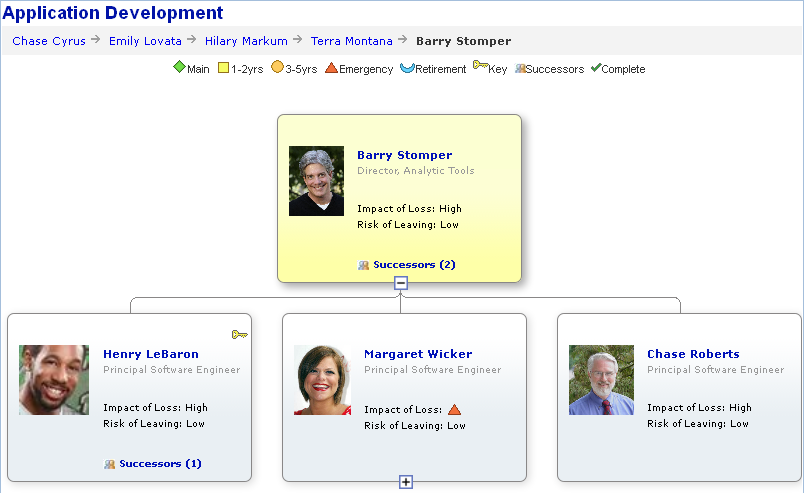
Image: Organization chart with breadcrumbs
The following example shows an organization chart with breadcrumbs:
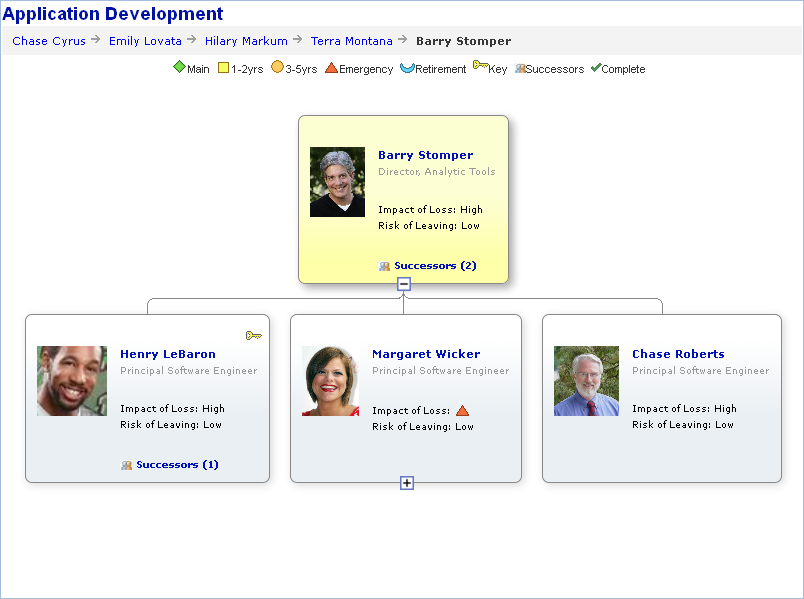
An organization chart can have only one set of breadcrumbs. The breadcrumbs appear horizontally at the top of an organization chart, above the chart legend if the legend is set. The breadcrumbs string wraps automatically if it is wider than the organization chart. If a breadcrumb contains a space, the breadcrumb string may wrap at the space, causing the breadcrumb to appear on two lines.
Style classes control the formatting of breadcrumbs. The default style classes are PT_ORGCHART_BRDCRM and PT_ORGCHART_UNLINK_BRDCRM. You can specify your own style classes using the CrumbDescrStyle and UnlinkCrumbDescrStyle properties.
You can specify an image to separate breadcrumb entries. If an image is not specified, the breadcrumbs are separated by three spaces. Each breadcrumb entry can be configured to be linkable. This configuration is similar to linkable text on organization chart nodes.
To implement breadcrumbs in an organization chart, you:
Clone the breadcrumb subrecord PTORGCRMB_SBR.
Add the clone of PTORGCRMB_SBR to a work record.
Add the work record to a page such that it is available in the component buffer so that PeopleCode can be invoked from the record fields.
One way to accomplish this is to include the record in a level 1 grid on the same page as the organization chart, and hide the grid.
To make a breadcrumb linkable, set the corresponding PTORGCRMBLINKABLE field to “Y”, in much the same way as you make a descriptor linkable in an organization chart node.
Add PeopleCode to provide application-specific processing when a linkable breadcrumb is selected.
When a user clicks a linkable breadcrumb, any FieldEdit and FieldChange PeopleCode in the PTORGCRMBID field executes.
At runtime, your PeopleCode will add rows to the work record that holds the information for each breadcrumb (person).
Each breadcrumb in a chart is defined by a row in the record.
See Organization Chart Subrecord Definitions, CrumbDescrStyle.
Breadcrumb Methods and Properties
The following OrgChart class methods and properties control the appearance of breadcrumbs:
SetCrumbData
SetCrumbRecord
UnlinkCrumbDescrStyle
CrumbDescrStyle
CrumbMaxDisplayLength
CrumbSeparatorImage
An organization chart node contains a set of descriptors. Each descriptor represents one element of data related to the node.
The descriptors for a node are defined in the organization chart node data record, which includes a clone of the PTORGNODE_SBR subrecord. The organization chart node record can define up to 99 descriptors. One row in the organization chart node record defines one node in the organization chart.
See “PTORGNODE_SBR” in Organization Chart Subrecord Definitions.
These fields on the PTORGNODE_SBR define the descriptors for a node (where n is a number from 1 to 99; for example, PTNODE_DESCR1):
PTNODE_DESCRn
PTNDDESCnLINKABLE
PTDESCRn_ICON_IMG
PTDESCRn_ICON_POS
PTORGNODE_SBR is delivered with fields for seven descriptors. If you are using a node display template and need additional descriptors, you will need to add sets of descriptor fields, to a maximum of 99 descriptors.
Use the PTNODE_DISPLAY_ID field to optionally designate a node display template, which defines other display characteristics for nodes.
See “Using Node Display Templates” in Designing Organization Chart Nodes.
Descriptor Fields
The PTNODE_DESCRn field specifies the text for a descriptor, where n is a number from 1 to 99 (for example, PTNODE_DESCR1).
The PTNDDESCnLINKABLE field specifies the descriptor type. A descriptor can be one of the following types:
Y - Linkable text
N - Static text
A - Related action menu
D - Linkable drop-down menu
R - Read-only (non-linkable) drop-down menu
L - Linkable drop-down list box
I - Linkable Icon
O - Icon only
M - IM icon
When a user clicks a linkable descriptor, a linkable drop-down menu item, or a drop-down list box item, FieldChange PeopleCode associated with the PTNDDESCnLINKABLE field executes.
See Organization Chart Actions and Events.
When a user selects a related action menu item, the corresponding action executes. PeopleSoft Related Content Framework must be configured for related action menus.
If the descriptor includes an icon, specify the image name and position using the PTDESCRn_ICON_IMG and PTDESCRn_ICON_POS fields.
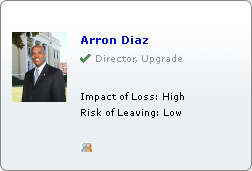
Suppose your application includes a node row with this data (some fields in the PTORGNODE_SBR subrecord are omitted for simplicity):
|
Field |
Value |
|---|---|
|
PTCHART_NODE |
ADIAZ |
|
PTPARENT_CHART_ND |
TMONT |
|
PTORGCHRTIMG |
(BLOB) |
|
PTNODE_DESCR1 |
Arron Diaz |
|
PTNDDESC1LINKABLE |
Y |
|
PTDESCR1_ICON_IMG |
|
|
PTDESCR1_ICON_POS |
|
|
PTNODE_DESCR2 |
Director, Upgrade |
|
PTNDDESC2LINKABLE |
|
|
PTDESCR2_ICON_IMG |
STATUS_COMP_ICN |
|
PTDESCR2_ICON_POS |
L |
|
PTNODE_DESCR3 |
Experience: Low |
|
PTNDDESC3LINKABLE |
Y |
|
PTDESCR3_ICON_IMG |
EXP_ICN |
|
PTDESCR3_ICON_POS |
R |
Image: Example of a node with a node image and descriptors
The following example shows the node that is created using the previous attributes:
Drop-down lists and IM presence icons require additional configuration.
See Configuring IM Presence (Optional).
Using Images with Organization Charts
If your organization chart uses images, such as photographs, then the scroll area or grid with the fields that contain the images must have unlimited occurs count enabled. That is, the Unlimited Occurs Count check box must be selected on any scroll area or grid that includes a record with the fields from PTORGNODE_SBR or PTORGPOPUPNODE_SBR, but only when images are used.
You can configure an organization chart to include menus and drop-down lists for any of the node descriptors.
Understanding Menus and Drop-Down Lists
This section discusses the following types of drop-downs:
Related action menu.
Drop-down menu.
Drop-down list box.
Related Action Menu
A related action menu is dynamically generated based on a related service configuration that has been defined in the PeopleSoft Related Content Framework. Related action links in the menu take the user directly to the target, using related values supplied by the node. Because the menu structure and links are defined by the related service configuration, the developer does not need to populate the drop-down rowset or to write PeopleCode for related action drop-down menus. You do need to verify that the related action services mapping page fields are included in the node record.
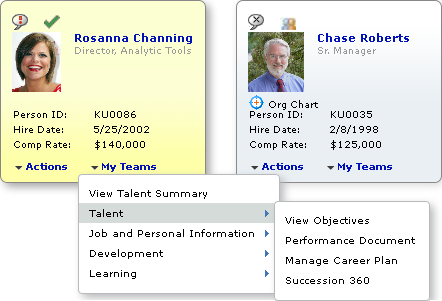
Image: Example of a related action drop-down menu
The following example shows a node configured with a related action menu.
Drop-Down Menu
A drop-down menu presents list items in a foldered menu structure.
Drop-down menus can contain folders and menu items. Folders can be nested.
A drop-down menu can be linkable or read-only. If the drop-down menu is linkable, FieldChange PeopleCode associated with the descriptor field PTNDDESCnLINKABLE executes when a user clicks on a menu item. If the drop-down menu is read-only, FieldChange PeopleCode does not execute.
Image: Example of a linkable drop-down menu
The following example shows a node configured with a drop-down menu.
Drop-Down List Box
A drop-down list box presents a list of linkable items.
Image: Example of a linkable drop-down list box
The following example shows a node with a drop-down list box.
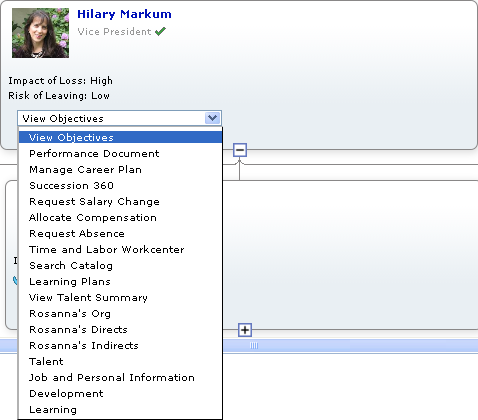
The width of a drop-down list box is the width of the widest list item that the box contains.
A related action menu is dynamically rendered based on related content configuration that is mapped to the level 1 chart node record field PTCHART_NODE on the chart page. The services that make up the related content configuration are rendered as links on the related actions menu. The related content layout defines the hierarchical structure of the related actions menu. A related content menu consists of folders and menu items. Folders can be nested.
Important! SmartNavigation has been deprecated. This information remains for backward compatibility only.
An Actions folder can also be configured to display in drop-down SmartNavigation menus (that is, the portal breadcrumb menu). The Actions folder displays depending on the configuration of related actions for SmartNavigation. If the related actions are attached at the chart component level, the Actions folder will not appear in the drown down menu. If the related actions are attached to the data source’s detail component, the Actions folder will appear in the drop down menu.
Related content services are defined using the Define Related Content Service component. Then, related actions are assigned using the Manage Related Content Service component. Both components are part of the PeopleSoft Related Content Framework.
See Creating and Managing Related Content Service Definitions and Configuring Related Content, Related Actions, and Menu and Frame Layouts.
To configure a descriptor as a related action menu, set the corresponding PTNDDESCnLINKABLE value to "A". Using the Manage Related Content Service component, associate the related actions as page level related content to the chart node record field PTCHART_NODE on the chart page at level 1.
For each drop-down, add the fields PTDESCRn_DD_ID and PTDESCRn_SI_ID to your node data record, where n represents the number of the descriptor. For example, to configure PTNODE_DESCR7 as a dropdown, add the fields PTDESCR7_DD_ID and PTDESCR7_SI_ID. Add one set of PTDESCRn_DD_ID and PTDESCRn_SI_ID for each descriptor you configure as a drop-down (PTNDDESCnLINKABLE="D", "R", or "L").
You will populate PTDESCRn_DD_ID with a unique identifer for the drop-down.
When the user clicks on a list item in the drop-down, the system sets the PTDESCRn_SI_ID field to the value of the list item ID, making it available for use by FieldChange PeopleCode.
Configuring the Node Record Without a Display Template
Oracle recommends using a display template to configure your organization chart. Organization charts created with PeopleTools version 8.51 do not use display templates. If your organization chart does not use a display template, you need to configure the node record differently.
Add the fields in the PTORGBOXFLD_SBR subrecord to your node record. The subrecord contains the fields PTDESCRn_DROPDOWN_ID and PTDESn_SLCT_ITM_ID, where n is an integer from 1 to 7, for example PTDESCR1_DROPDOWN_ID and PTDES1_SLCT_ITM_ID, and so on.
You will populate PTDESCRn_DROPDOWN_ID with a unique identifer for the drop-down.
See “PTORGBOXFLD_SBR” in Organization Chart Subrecord Definitions.
To configure a descriptor as a drop-down menu or drop-down list box:
Set the PTNDDESCnLINKABLE field to “D” for a linkable drop-down menu.
Set the field to “R” for a read-only (non-linkable) drop-down menu.
Set the field to “L” for a linkable drop-down list box.
Populate the PTDESCRn_DD_ID field (or the PTDESCRn_DROPDOWN_ID if your chart does not use a display template) with the drop-down ID.
Create a derived/work record that contains the fields in the subrecord PTORGBOXLST_SBR.
Add PeopleCode to set the drop-down data record and the drop-down rowset.
For example:
&ocPBOrg.SetDropDownRecord(Record.DropDown);
&ocPBOrg.SetDropDownData(&rsDropDown);
Populate the drop-down data rowset with the list information for each of the drop-down list IDs.
Place FieldChange PeopleCode on the PTNODE_DESCRn field to perform corresponding logic when a list item is selected in a linkable drop-down.
The drop-down rowset defines the content for drop-down listboxes and defines the menu structure as well as the content for drop-down menus.
Populate the drop-down ID field (PTDESCRn_DD_ID using a display template, or PTDESCRn_DROPDOWN_ID if not using a display template) on the node record with a unique identifier, such as EMPL.
Populate the drop-down data rowset according to these rules:
Each list item in the menu is either a folder or a menu item.
Assign a unique value in PTORGDRPLSTITM_ID for each item.
Populate PTNODE LISTDESCR with a label for each item.
Folders have children.
Menu items have no children.
Determine the parent for each item. This is the group ID.
Set PTORGDRPLS_ GRP_ID to the parent ID, PTORG DRPLSTITM_ID.
Top-level list items have no parent. Set the group ID to blank.
Drop-down list box items have no parent. Set the group ID to blank.
Determine the display order of each list item within its group.
For example, suppose you want to create a drop-down menu with the following structure:
|
Level 1 |
Level 2 |
Level 3 |
|---|---|---|
|
Talent |
Teamwork |
|
|
Planning |
||
|
Compensation |
Objectives |
Objective A |
|
Objective B |
||
|
Performance |
Self Appraisal |
|
|
Peer Appraisal |
||
|
Time |
||
|
Absence |
For this example, the drop-down data rowset contains these rows:
|
PTDESCR_ DRP DWN_ID |
PTORG DRPLST ITM_ID |
PTORG DRPLS_ GRP_ID |
PTND_ DISPLAY_ ORDER |
PTNODE LISTDESCR |
|---|---|---|---|---|
|
EMPL |
TALENT |
1 |
Talent |
|
|
EMPL |
COMP |
2 |
Competency |
|
|
EMPL |
TIME |
3 |
Time |
|
|
EMPL |
ABS |
4 |
Absence |
|
|
EMPL |
TEAM |
TALENT |
1 |
Teamwork |
|
EMPL |
PLAN |
TALENT |
2 |
Planning |
|
EMPL |
OBJ |
COMP |
1 |
Objectives |
|
EMPL |
PERF |
COMP |
2 |
Performance |
|
EMPL |
OBJA |
OBJ |
1 |
Objective A |
|
EMPL |
OBJB |
OBJ |
2 |
Objective B |
|
EMPL |
SELF |
PERF |
1 |
Self Appraisal |
|
EMPL |
PEER |
PERF |
2 |
Peer Appraisal |
Set the style sheet for the drop down descriptor using the PT_CNT_STYLE field on the node display record.
The default style sheet for the drop down depends on the display type of the descriptor.
The following list shows the default style sheet for each drop down type:
A – PT_ORGNODE_DESC7
D - PT_ORGNODE_DESC7
R - PT_ORGNODE_DESC7
L – PT_ORG_DDLIST
The style class for the drop down list item is set using the PTORGLISTDESCSTYLE field in the drop down record. If no style is specified, the default style class is used.
The default style sheet for the drop down list item is:
A - PT_ACTION_LIST_ITEM
D - PT_ACTION_LIST_ITEM
R - PT_READONLY_LIST_ITEM
If an organization chart displays people, you can configure the chart to show a person’s IM presence as part of their node. A user could then start a chat session in a chat client with the person from the organization chart.
Image: Example of a node with an IM presence icon
The following example shows a node with an IM presence icon showing that the person is offline:
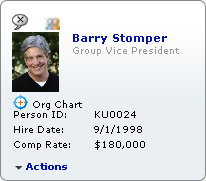
The following icons indicate a person’s IM presence:
|
Field or Control |
Definition |
|---|---|
 |
Online |
 |
Offline |
 |
Error |
You can specify the position of the IM icon using a node display template. If your chart does not use a node display template then the IM icon appears at top left corner of the node.
If a person’s IM indicator shows that the person is available, a user can click on the indicator to start a chat session. The chat session opens in the standard chat client for the domain. For example, if the IM is a Yahoo domain, then Yahoo Messenger launches.
When a user hovers over an IM icon, the data hint text that is specified in the subrecord is displayed along with the IM status. For example, abc@example.com is available or abc@example is offline.
For domains that support offline messages, if a person’s IM indicator shows that the person is offline, the user can click on the indicator and leave offline messages.
Retrieving XMPP presence requires MCF IM to be configured. If MCF IM is not correctly configured, an Offline icon is displayed with the data hint: ‘MCF IM is not configured’.
If there is an error, an Error icon is displayed and ‘Unable get IM status for <user>' is displayed as the data hint.
Note: With the XMPP protocol, a user can get presence information for their buddies only. The status appears as offline for a person who is not the user’s buddy.
Organization chart IM supports the following IM protocols:
XMPP
MSN
Yahoo
Implementing IM Presence
The organization chart IM feature uses PeopleTools Multi Channel Framework (MCF) to detect a person’s IM presence and start a chat.
Instant messaging must be configured in MCF before you can implement organization chart IM presence.
Note: IM presence behavior may vary depending on which IM domain is used. Refer to the MCF documentation for current details regarding IM presence for each of the domains.
See “Using Node Display Templates” in Designing Organization Chart Nodes, Configuring Instant Messaging Server Details.
To implement IM presence:
Create a derived/work record that includes a clone of the PTORGIM_SBR subrecord definition. The IM information record should not be in the component buffer.
Populate the work record with the IM data.
Create a standalone rowset and populate it with the data from the IM record.
Note: An organization chart displays IM presence for only one IM user ID for each person (node). If more than one IM user ID is defined for a node, only the first one fetched is used.
Example:
&rsIM = CreateRowset(Record.QE_ORG_IM);
&rsIM.Fill("Where QE_ORG_TC=:1", QE_ORG_TESTCASE.QE_ORG_TC.Value);
Set the OrgChart class IM properties.
Example:
&oOrgChart.IMPresence = True;
&oOrgChart.SetIMRecord(Record.QE_ORG_IM);
&oOrgChart.SetIMData(&rsIMData);
&oOrgChart.IMRefreshInterval = 60;
Set the PTNDDESCnLINKABLE field to “M” for the corresponding nodes.
See “PTORGIM_SBR” in Organization Chart Subrecord Definitions.
PTORGIM_SBR Data Example
The following table shows sample data for the PTORGIM_SBR fields:
|
PTCHART_NODE |
MCF_IMUSERID |
MCF_IM_PROTOCOL |
MCFIMDOMAIN |
MCF_IMUSERANDNET |
|---|---|---|---|---|
|
STOMPER |
barry.stomper@oracle.com |
XMPP |
BEEHIVE |
barry.stomper@oracle.com |
|
LEBARON |
hlebaron216 |
YAHOO |
YAHOO |
hlebaron216@yahoo.com |
|
ROBERTS |
F2a66c8e51870b5 |
MSN |
MSN |
blueskies@hotmail.com |
Chatback Badges
MSN requires a chatback badge in order for organization chart IM to initiate a chat. See the MultiChannel Framework subject area for details on how to configure instant messaging .
This section describes the basic design of an organization chart node and explains how to use node display templates to configure more complex organization chart nodes.
Using Node Display Templates
You can optionally define node display templates for more precise control over the display characteristics of descriptors on a node.
A node display template is keyed to a single organization chart node row, using the PTNODE_DISPLAY_ID field. A node display template comprises the set of rows that share a value in PTNODE_DISPLAY_ID. Conversely, an organization chart node is associated with a single node display template.
Each row in the node display template defines one descriptor.
Using a node display template, you control:
Which descriptors appear on the node. Only descriptors included in the node display template and that have PT_DISPLAY_FLAG set to “Y” will appear in the node.
Display type of descriptors (this overrides display types set in PTNDDESCnLINKABLE).
Line position and display order of a descriptor.
Number of display items on a node line.
Spacing between descriptors.
You can associate a node display template with one or more schemas, or zoom levels. Each schema level assigns different display characteristics to the descriptors.
See Implementing Zoom Schemas (Optional).
You can define your chart to use different node display templates for different nodes by assigning different values to PTNODE_DISPLAY_ID. For example, you might choose to configure the nodes for executive management to display names and photos, but no telephone numbers, locations, emails, or IM presence, while nodes for everyone else display telephone numbers, locations, and emails, but not photos.
Implementing Node Display Templates
To implement node display templates:
Create a node display record that includes a clone of the PTNODE_DISP_SBR.
Add PeopleCode to set the node display record and the node display rowset.
For example:
&ocPBOrg.SetNodeDisplayDataRecord(Record.&recDisplay);
&ocPBOrg.SetNodeDisplayData(&rsDisplay);
See “PTNODE_DISP_SBR” in Organization Chart Subrecord Definitions.
See SetNodeDisplayData.
Example: Designing a Node
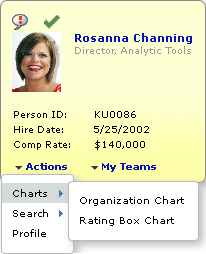
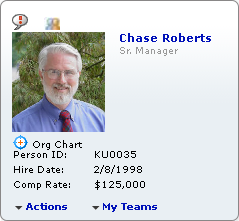
Image: Example of a node with complex layout
This section demonstrates how to lay out a node that looks like the following example:
Node Descriptors
The organization chart node (PTORGNODE_SBR) sample data in the following table generates the descriptors in the previous node example (for simplicity, not all fields are shown):
|
Field |
Data |
|---|---|
|
PTCHART_NODE |
CROBE |
|
PTPARENT_CHART_ND |
BSTOM |
|
PTND_DISPLAY_ORDER |
3 |
|
PTNODE_DESCR1 |
Chase Roberts |
|
PTNDDESC1LINKABLE |
Y |
|
PTNODE_DESCR2 |
Sr. Manager |
|
PTNODE_DESCR3 |
My Teams |
|
PTNDDESC3LINKABLE |
D |
|
PTNODE_DESCR4 |
KU0035 |
|
PTNODE_DESCR5 |
2/8/1998 |
|
PTDESCR5_ICON_POS |
L |
|
PTNODE_DESCR6 |
$125,000 |
|
PTNDDESC6LINKABLE |
N |
|
PTNODE_DESCR7 |
Actions |
|
PTNDDESC7LINKABLE |
A |
|
PTDESCR7_ICON_POS |
L |
|
PTADJUSTFORNULLS |
Y |
|
PTNODE_DISPLAY_ID |
DEMO17 |
|
PTPHOTO_START |
2 |
|
PTNODE_DESCR8 |
Org Chart |
|
PTDESCR8_ICON_IMG |
QE_ORG_CHART_ICON |
|
PTDESCR8_ICON_POS |
L |
|
PTNDDESC8LINKABLE |
Y |
|
PTNODE_DESCR9 |
Person ID: |
|
PTNODE_DESCR10 |
Hire Date: |
|
PTNODE_DESCR11 |
Comp Rate: |
|
PTNODE_DESCR12 |
|
|
PTNDDESC12LINKABLE |
|
|
PTNODE_DESCR13 |
Org chart |
|
PTDESCR13_ICON_IMG |
QE_SUCCSORGCHART |
|
PTDESCR3_DD_ID |
DEMO17B |
|
PTDESCR7_DD_ID |
DEMO17 |
Node Display Template
The organization chart node display (PTNODE_DISP_SBR) data looks like this:
|
PTNODE _DISPLAY_ID |
PT_SCHEMA_LEVEL_ID |
PT_CNT_ID |
PT_NODE_VIEW |
PT_LINE_ NUM |
PTND_ DISPLAY_ ORDER |
PT_DISPLAY_TYPE |
PT_PADDING_ LEFT |
PT_ PADDING_ RIGHT |
|---|---|---|---|---|---|---|---|---|
|
DEMO17 |
3 |
PTNODE_DESCR12 |
VIEW1 |
1 |
1 |
M |
Y |
0 |
|
DEMO17 |
3 |
PTNODE_DESCR13 |
VIEW1 |
1 |
2 |
I |
Y |
0 |
|
DEMO17 |
3 |
PTNODE_DESCR1 |
VIEW1 |
2 |
1 |
Y |
Y |
0 |
|
DEMO17 |
3 |
PTNODE_DESCR2 |
VIEW1 |
3 |
1 |
N |
Y |
0 |
|
DEMO17 |
3 |
PTNODE_DESCR8 |
VIEW1 |
4 |
1 |
Y |
Y |
0 |
|
DEMO17 |
3 |
PTNODE_DESCR9 |
VIEW1 |
5 |
1 |
N |
Y |
0 |
|
DEMO17 |
3 |
PTNODE_DESCR4 |
VIEW1 |
5 |
2 |
N |
Y |
0 |
|
DEMO17 |
3 |
PTNODE_DESCR10 |
VIEW1 |
6 |
1 |
N |
Y |
0 |
|
DEMO17 |
3 |
PTNODE_DESCR5 |
VIEW1 |
6 |
2 |
N |
Y |
0 |
|
DEMO17 |
3 |
PTNODE_DESCR11 |
VIEW1 |
7 |
1 |
N |
Y |
0 |
|
DEMO17 |
3 |
PTNODE_DESCR6 |
VIEW1 |
7 |
2 |
N |
Y |
0 |
|
DEMO17 |
3 |
PTNODE_DESCR3 |
VIEW1 |
8 |
2 |
D |
Y |
0 |
|
DEMO17 |
3 |
PTNODE_DESCR7 |
VIEW1 |
8 |
1 |
A |
Y |
0 |
Default Node Design
Node display templates are a feature of PeopleTools Release 8.52. Organization charts created prior to PeopleTools Release 8.52 continue to be supported using the default node design.
Oracle recommends using node display templates for PeopleTools Release 8.52 and later organization charts. If you choose not to implement the optional node display templates, your organization chart will follow the default node design. An organization chart that is defined using the default node design has the following characteristics:
If an icon image is specified in the PTNDMAINICON_IMAGE field, it appears on the first line, at the right.
If a node image, such as a photo, is specified (PTORGCHRTIMG), it appears by default on the left, beginning on line two. You can use the ImageLocation property to specify left or right position.
Each descriptor appears on a separate line. The node displays the first seven descriptors, ordered by the descriptor number.
PTDESCR_UNDER_IMG specifies the first line that appears under the image. Previous lines appear beside the image.
Adjusting Node Sizing
By default, organization chart nodes are sized dynamically based on the contents of the node and can vary from node to node.
For a vertical organization chart, the width of each node is based on the width of the data in the node. Width can vary from node to node. All the nodes in a given row are the same height, based on height of the tallest node, but node height can vary from row to row.
For a horizontal organization chart, the height of each node is based on the height of the data in the node. Height can vary from node to node. All the nodes in a given column are the same width, based on width of the widest node, but node width can vary from column to column.
You can use the NodeProportion property to control how nodes are sized on a chart. NodeProportion takes the following values:
0 = Variable node sizing. (Default.)
1 = Uniform node height.
2 = Uniform node width.
3 = Uniform node height and width.
4 = Square nodes.
Image: Vertical organization chart with uniform node sizes
The following example shows a vertical organization chart with uniform node height and width (NodeProportion = 3):
Applying constant node widths can create nodes with extra blank space in the node. You can reduce the node width by reducing value of the NodeMaxDisplayDescLength property.
See NodeProportion.
Node views allow you to display alternate information on a node. Using node views, you can determine which attributes to show in the node based on the organization chart’s node display template. For instance, one node view might show a person’s name, photo, and job information, while another view might show that person’s name and contact information.
Users are able to select different node views of the organization chart to see less or more data in the nodes. When node views are implemented for an organization chart, the chart displays a view controller that enables a user to select a node view.
You can define multiple node views for an organization chart. A node view definition would include a full definition of the node contents defined by the following attributes:
Which icons are displayed.
Which descriptors are displayed.
The style of the node descriptor.
The position of the descriptors on the node.
Node View Controller
The node view controller appears in the top part of the chart above the nodes but below any chart breadcrumbs or legend. The node view controller is made up of push buttons without text where each button represents a view. A data hint is used to provide the text description of the view.
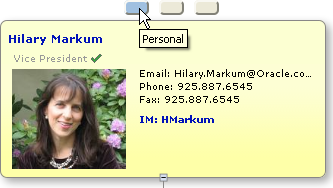
Image: Node view controller with a data hint
The node view controller in this example displays the “Personal” node view data hint:
Creating Node Views
To set up the node view controller to enable node views, use the following two organization chart methods:
&oOrgChart.SetNodeViewEntries(&NodeViewArray);
&oOrgChart.SetNodeViewText(&NodeViewText);
NodeViewArray represents an array of node view IDs. NodeViewText is an array of data hints for each corresponding node view ID.
Additionally, the organization chart property, InitialView, must be set to indicate which view is initially displayed in the chart. For example, the property might be set as follows to show the view that is labeled “Personal.”
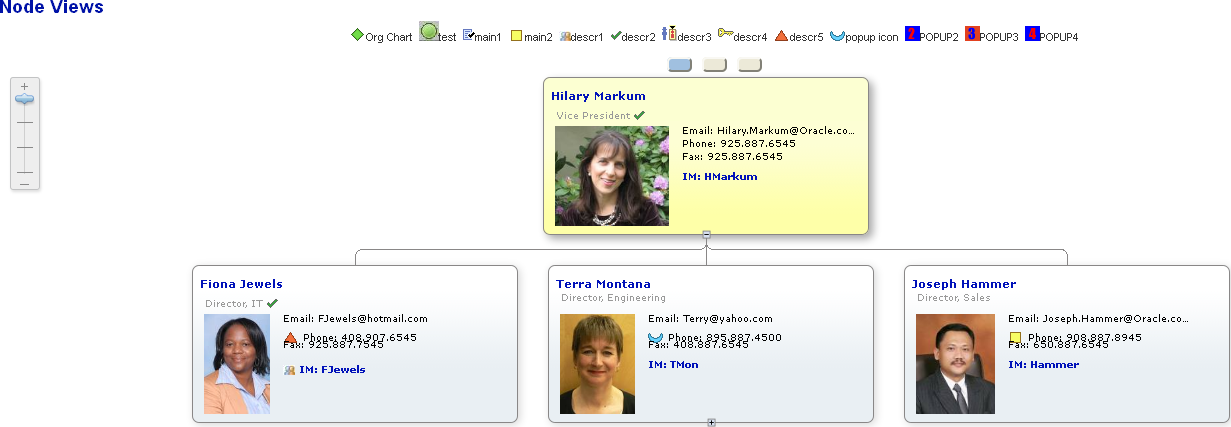
&OrgChart.InitialView="VIEW1";Image: Organization chart with three node views
The following example shows an organization chart with three node views defined:
Transitioning between node views will be done without a server trip. Therefore, it’s not possible to have a field change event when changing between views. Also, once the user navigates away from the chart or the chart is refreshed, the current view state is not saved. Therefore, the chart will always show the initial view set in the chart property whenever the chart is viewed again.
Zoom schemas enable you to define different visual schemas for organization charts.
Although schemas are designed to give the appearance of zooming in or out on the organization chart, in fact they are predefined views of the organization chart at different levels. Using schemas, you define what attributes to show on the node, and which nodes are displayed in each schema level. Users are able to select different views of the organization chart to see more or fewer nodes, and to see less or more data in the nodes.
You can define up to ten schema levels for an organization chart.
When zoom schemas are implemented for an organization chart, the chart displays a zoom control that enables a user to select a schema level.
Image: Example of an organization chart displaying schema level 3
The following example shows an organization chart with a zoom control and four schemas defined. The chart in this example displays schema level 3.
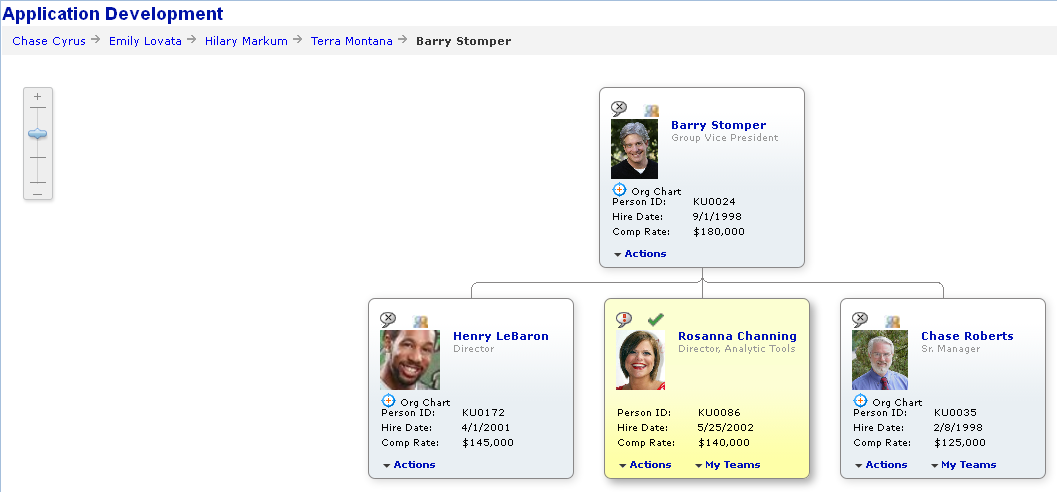
Image: Example of an organization chart displaying schema level 1
The chart in the following example displays schema level 1, which displays less data on each node, allowing the chart to display more nodes in the same area.
Each schema level defines the following attributes, based on the organization chart’s node display template:
Which icons are displayed.
Which descriptors are displayed.
The style of the node descriptor.
The position of the descriptors on the node.
See “Using Node Display Templates” in Designing Organization Chart Nodes.
In addition, you can place FieldChange PeopleCode on the PTCHART_SCHEMA_ID field of the node record to control which nodes are displayed.
When the user changes schema levels, FieldChange PeopleCode on the PTCHART_SCHEMA_ID field of the node record executes. You can set the DISPLAYED_FLAG field on the node data rowset to control whether a node is displayed at the new schema level, or you can use PeopleCode to populate the organization chart node data rowset with only the nodes you want available at the new schema level.
Use the SchemaLevel object ImageHeight property to define whether the image (photo) is displayed in the node and the height of the image.
The size of the chart nodes is determined dynamically based on the subset of data within the node and the corresponding style properties for the schema level.
SchemaLevel Class
The SchemaLevel PeopleCode class provides methods and properties to set organization chart display information for each schema level.
SchemaLevel objects are declared using the SchemaLevel data type.
For example:
Local SchemaLevel &SchemaLevel1;
Component Chart &Abs_Hist_Chart;
Instantiate SchemaLevel objects using the CreateObject(“SchemaLevel”) PeopleCode function.
Implementing Schema Zooming
To implement schema zooming:
Add PeopleCode to specify the intial schema level.
Example:
&oOrgChart.ChartCurrentSchemaLevel=4;Instantiate a SchemaLevel object for each schema level your chart will use.
Example:
SchemaLevel &oSchemaLevel1 = Createobject("SchemaLevel");Add PeopleCode to define each schema level.
Example:
/*** Create an instance of of schema zoom level 1 class and instantiate it ***/
SchemaLevel &oSchemaLevel1 =Createobject("SchemaLevel");
&oSchemaLevel1.ID=1;
& oSchemaLevel1.ImageHeight=0;
/*** Create an instance of of schema zoom level 2 class and instantiate it  ***/
SchemaLevel &oSchemaLevel2 =Createobject("SchemaLevel");
&oSchemaLevel2.ID=2;
& oSchemaLevel2.ImageHeight=40;
/*** Create an instance of of schema zoom level 3 class and instantiate it ***
SchemaLevel &oSchemaLevel3 =Createobject("SchemaLevel");
& oSchemaLevel3.ID=3;
& oSchemaLevel3.ImageHeight=45;

/*** Create an instance of of schema zoom level 4 class and instantiate it  ***/
SchemaLevel &oSchemaLevel4 =Createobject("SchemaLevel");
&oSchemaLevel4.ID=4;
& oSchemaLevel4.ImageHeight=50;
Assign the SchemaLevel instances to the OrgChart object.
Example:
/***   Assign the 4 schema level instance to the org chart object ***/
&SchemaLevls=CreateArray(&oSchemaLevel1, &oSchemaLevel2, &oSchemaLevel3,
&oSchemaLevel4)
&oOrgChart.SetZoomSchemaLevels(&SchemaLevls)
Write FieldChange PeopleCode on the PTCHART_SCHEMA_ID field to execute when the user clicks on the schema zoom control to change the schema level.
Example:
Component Rowset &rs, &rsGrid; Component object &oOrgChart; rem WinMessage("value =" | &oOrgChart.ChartCurrentSchemaLevel); ¤tZoom = &oOrgChart.ChartCurrentSchemaLevel; If ¤tZoom = 1 Then /* display all records and no image */ For &i = 1 To &rsGrid.ActiveRowCount &RecGrid = &rsGrid.GetRow(&i).GetRecord(Record.QE_ORG_Z2_DRV); &RecGrid.GetField(Field.PTDESCR_UNDER_IMG).value = 0; /* show all records */ &RecGrid.GetField(Field.DISPLAYED_FLAG).value = "Y" End-For; Else If ¤tZoom = 2 Then &limit = 6; Else If ¤tZoom = 3 Then &limit = 4; Else &limit = 3; End-If; End-If; For &i = 1 To &rsGrid.ActiveRowCount &RecGrid = &rsGrid.GetRow(&i).GetRecord(Record.QE_ORG_Z2_DRV); &RecGrid.GetField(Field.PTDESCR_UNDER_IMG).value = 3; If &RecGrid.GetField(Field.QE_ORG_SCHEMA_ROW).value < &limit Then &RecGrid.GetField(Field.DISPLAYED_FLAG).value = "Y"; Else &RecGrid.GetField(Field.DISPLAYED_FLAG).value = "N"; End-If; End-For; End-If;
Schema Events
When a user selects a different schema level using the zoom control, the following events take place:
The system sets the value in the CurrentSchemaLevel property to the new schema value.
The systems sets the value in the PTCHART_SCHEMA_ID to the new schema value.
FieldChange PeopleCode on the PTCHART_SCHEMA_ID field executes.
The system displays the organization chart at the new schema level.
You can also set the CurrentSchemaLevel property using PeopleCode.
If an organization chart is larger than the viewable area, the user needs to scroll to view other areas of the chart. You can specify whether the organization chart will use scroll bars or alternative scrolling.
Image: Example of an organization chart using alternative scrolling
If you specify alternative scrolling, a scroll navigator and a hand cursor appear instead of vertical and horizontal scroll bars.
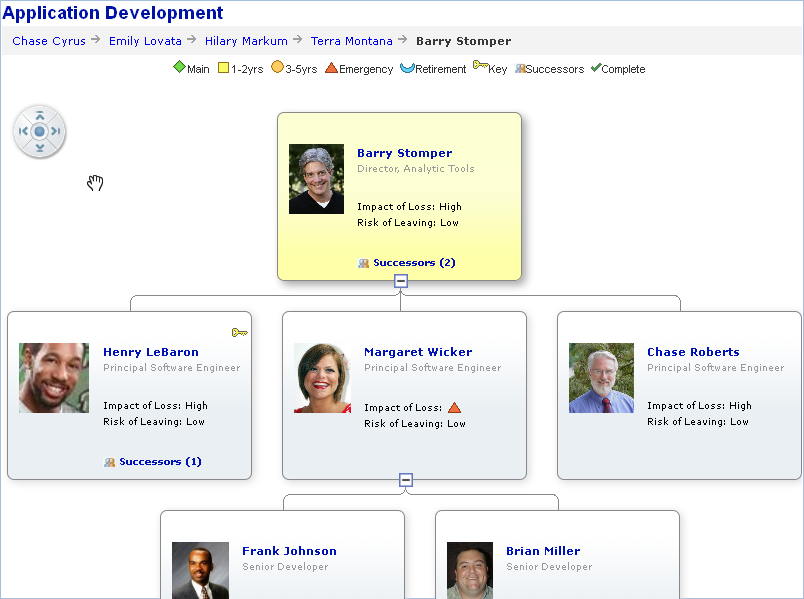
Note: On an Apple iPad a user navigates using two fingers on a touch screen, so scroll bars, the scroll navigator, and mouse hand features are not displayed on an Apple iPad.
The arrows on the scroll navigator enable the user to quickly position the right, left, top, or bottom of the chart in the viewable area.
If the user scrolls the chart, the center button of the scroll navigator returns the chart to its initial display position. If the user changes focus by selecting a different node, the chart centers on that node. The center button then returns the chart to display centered on the focus node.
If alternative scrolling is implemented, the user can dismiss a dropdown menu only by clicking within the node areas in the chart unless no scrolling is needed, in which case the user can click on the background or on a node to dismiss the menu.
Note: If the breadcrumbs and chart legend are so large that there is not sufficient room to display the scroll navigator in the upper left portion of the chart, it will appear in the lower left corner.
The hand cursor enables the user to grab the background of the chart and move it within the viewable area.
Note: When using the hand cursor to scroll, you must position the hand cursor in the chart area outside the chart nodes and popup nodes. Scrolling does not work if the hand cursor is positioned within a chart node or pop-up node.
Use the ChartScrollType property to specify which type of scrolling to use. The default is scroll bars.
Use the PTCONNECTLINESTYLE field on the organization chart node record to specify the style sheet that defines the following characteristics of the connector lines:
Line style (unbroken, broken, pattern)
Line weight
Line color
The PSORGCHART style sheet includes these style classes for connector lines:
|
Style Class |
Connector Style |
|---|---|
|
PT_ORGCHART_CONNECT1 |
Solid gray |
|
PT_ORGCHART_CONNECT2 |
Solid black |
|
PT_ORGCHART_CONNECT3 |
Dotted red |
|
PT_ORGCHART_CONNECT4 |
Dashed gray |
The default connector line style class is PT_ORGCHART_CONNECT1 (solid gray).
Use the PTNODESTYLENAME field on the organization chart node record to specify the style sheet that defines the following characteristics of the node border:
Line style (unbroken, broken, pattern)
Line weight
Line color
Shading
Shading color
The PSORGCHART style sheet includes these style classes for connector lines:
|
Style Class |
Connector Style |
|---|---|
|
PT_ORGNODE |
Solid gray |
|
PT_PT_ORGNODE_DASH |
Dashed gray |
The default node border style class is PT_ORGNODE.
Note: We recommend using the default line weight, 1 pixel, for connector lines and node borders. Thicker line weights may cause inconsistencies between connector lines and node borders.
An organization chart can execute FieldEdit or FieldChange PeopleCode in response to these user actions:
Select an expand/collapse icon.
Click a descriptor link.
Select a linkable drop-down menu item or drop-down list box item.
Close a pop-up node.
Select a breadcrumb.
Click on a node image.
Click on a node.
Selecting Expand/Collapse Icons
When the user clicks an expand/collapse icon, the system toggles the EXPANDED_FLAG field value from “Y” to “N” or from “N” to “Y” and changes the icon on the node to collapsed or expanded, correspondingly. This action triggers field change processing (FieldEdit and FieldChange events) on EXPANDED_FLAG. Typically, FieldChange PeopleCode checks the EXPANDED_FLAG and PARENT_FLAG of the node and performs these actions:
If
EXPANDED_FLAG="Y"andPARENT_FLAG="X", loads the child rows into the rowset and setsPARENT_FLAG="Y". The updates appear when the chart is refreshed.If
EXPAND_FLAG="N"(collapse action), it does nothing.If
EXPAND_FLAG="Y"(expand action) andPARENT_FLAG="Y"(child data is already in rowset), it does nothing.
Note: If your PeopleCode doesn’t populate the CollapsedImage and ExpandedImage properties of the organization chart, then no expand/collapse icon appears on any nodes in the chart, and the expand/collapse action is disabled for the chart.
Clicking a Descriptor Link
When the user clicks a descriptor link or linkable drop-down list item, field change processing is triggered on the PTNODE_DESCRn field in the node record.
For instance, suppose descriptor 2 is linked to a pop-up chart. When the user clicks the descriptor 2 link, FieldChange PeopleCode on the PTNODE_DESCR2 field in the node record performs the following actions:
Sets the node’s
PTPOPUPEXPAND_FLAG ="Y".Sets the node’s
PTPOPUPHDRMAINDESC.Sets the node’s
PTPOPUPHDRMAINICON.If the node’s
PTHASPOPUP_FLAG ="X", then populates the pop-up node rowset and setsPTHASPOPUP_FLAG ="Y"to indicate that the node’s descriptor was clicked for the first time.Refresh the chart with the pop-up displayed.
Closing a Pop-up Node
When the user closes a pop-up node it triggers field change processing on the PTPOPUPEXPAND_FLAG field.
FieldChange PeopleCode
on the PTPOPUPEXPAND_FLAG field would need to restore any changes
that were made to the originating node's display characteristics and
reset the node’s PTPOPUPEXPAND_FLAG ="N" .
Selecting a Linkable Menu Item or Drop-Down List Box Item
When a user selects a linkable menu item or drop-down list box item, the system sets the PTDESCRn_SI_ID (PTDESn_SLCT_ITM_ID if not using a node display record) field value to the value of the list item ID and FieldChange PeopleCode associated with the PTNDDESCnLINKABLE field executes.
Selecting a Breadcrumb
When a user clicks on a linkable breadcrumb, any FieldEdit and FieldChange PeopleCode in the PTORGCRMBID field executes. Typically PeopleCode is used to redraw the organization giving focus to the node that was clicked.
Clicking on a Photograph
When a user clicks on a node image, field change PeopleCode on the PTNDMAINICON_IMAGE field executes.
Clicking on a Node
When a user clicks on the body of a node – not on a link, linkable drop-down list, or image – field change PeopleCode on the PTCHART_NODE field executes.
This section describes the following organization chart subrecord definitions:
PTORGNODE_SBR
PTORGGPOPUP_SBR
PTORGCRMB_SBR
PTORGBOXLST_SBR
PTORGBOXFLD_SBR
PTORGIM_SBR
PTNODE_DISP_SBR
PTORGNODE_SBR
This table describes the fields in PTORGNODE_SBR:
|
Field |
Description |
|---|---|
|
PTCHART_NODE |
Specifies the node name. This is a key field. |
|
PTPARENT_CHART_ND |
Specifies the parent of the current chart node. This is a key field. If a node does not have a parent node defined, then the node is placed on the first level. |
|
PTND_DISPLAY_ORDER |
Specifies the display order of the sibling nodes for the same parent node. Nodes display left to right according to display order. By default, the nodes are ordered as they appear in the rowset. |
|
PTCONNECTLINESTYLE |
Specifies the style class name for connection line style. The default style class is PT_ORGCHART_CONNECT1. |
|
PTNDMAINICON_IMAGE |
Specifies the main icon image name for the node. |
|
PTNODESTYLENAME |
Specifies the style class name for the node to control node background color, border, style, and so on. The default style class is PT_ORGNODE. |
|
PTFOCUS_FLAG |
Specifies a focused node (that is, the node that has focus). Y – Focused node. N – Not a focused node. If more than one node is set to focused, only the first focused node in the rowset will be recognized as the focused node. The default is “N”. |
|
PARENT_FLAG |
Indicates whether a node is a parent. Y – The node is a parent and its direct children are already loaded into the rowset. X – The node is a parent and its direct children are not loaded in the rowset (that is, they will be loaded on demand). N – The node is not a parent. The default value is “N”. An expanded/collapsed icon is only displayed on the parent node. If your PeopleCode does not set the CollapsedImage and ExpandedImage properties of the organization chart, no expanded/collapsed icon is displayed on any of the nodes and all expand/collapse actions are disabled. |
|
EXPANDED_FLAG |
Indicates whether the node is expanded or collapsed. Y – The chart shows the node expanded with the expanded image icon and its immediate children displayed. N – The chart shows the node collapsed with the collapsed image icon. |
|
DISPLAYED_FLAG |
Specifies whether the node displays in the chart. Y – The node displays
if the parent node's N – This node and its child nodes do not display in the chart's display area. The default is “Y”. |
|
PTHASPOPUP_FLAG |
Indicates whether the node has a pop-up. Y – This node has a link that invokes a pop-up and the data for the pop-up is already loaded into the pop-up node rowset. X – This node has a link that invokes a pop-up and the data for the pop-up is not loaded in the rowset. The data will be loaded on demand. N – This node does not have a link to invoke a pop-up chart. The default value is “N”. |
|
PTPOPUPEXPAND_FLAG |
Indicates whether a node’s pop-up nodes display. Y – Pop-up nodes display. N – No pop-up nodes display. If the user clicks the close icon in the pop-up node, the FieldChange event for PTPOPUPEXPAND_FLAG executes. The application sets the value of PTPOPUPEXPAND_FLAG to “N” when the pop-up node is closed. |
|
PTNODE_DESCRn |
Specifies the text for descriptorn of the node, wheren is an integer that starts at 1 and increments by one for each descriptor used by the chart; for example, PTNODE_DESCR2. The PTORGNODE_SBR subrecord is delivered with fields for descriptors 1 – 7. If you need more than seven descriptors, add a set of descriptor fields (PTNODE_DESCRn, PTNDDESCnLINKABLE, PTDESCRn_ICON_IMG, and PTDESCRn_ICON_POS) for each additional descriptor, to a maximum of 99 descriptors. If this is an icon-only descriptor (PTNDDESCnLINKABLE = “I” or “O”), the text in this field is used as the data hint for the icon. The maximum length is 50 characters. |
|
PTNDDESCnLINKABLE |
Specifies the descriptor type for descriptor n, where n is an integer from 1 to 99; for example, PTNDDESC2LINKABLE. Y - Linkable text N - Static text I - Linkable Icon O - Icon only A -Related action menu D - Linkable drop-down menu R - Read-only (non-linkable) drop-down menu L - Linkable drop-down list box M - IM icon The default value is “N”. The value in this field is overridden by the node display template, if one is implemented. |
|
PTDESCRn_ICON_IMG |
Specifies the name of the image associated with descriptor n, where n is an integer from 1 to 99; for example, PTDESCR2_ICON_IMG. For icon-only descriptors ("I" or "O"), the text in PTNODE_DESCRn is the data hint text. Note: If PTDESCRn_ICON_IMG is set to a valid image, the image is only displayed if PTNDDESCnLINKABLE is set to “Y”, “N”, “I”, or “O”.. |
|
PTDESCRn_ICON_POS |
Indicates the position of the icon relative to descriptor n, where n is an integer from 1 to 7; for example, PTDESCR2_ICON_POS. L – To the left of the description. R – To the right of the description. The default value is based on user language. For instance, “L” for English and “R” for Hebrew. |
|
PTADJUSTFORNULLS |
Indicate whether to collapse empty attributes to conserve vertical space within the nodes. Y – Collapse. N – Do not collapse. The default value is “N”. |
|
PTPOPUPHDRMAINDESC |
Specifies the main descriptor of the pop-up chart header for this node |
|
PTPOPUPHDRMAINICON |
Specifies the name of the image to place on the top left of the pop-up chart header. |
|
PTORGCHRTIMG |
Specifies the node image. The maximum image size depends on your database platform. Note: If this field is placed on a grid on the page and the column is hidden (Visible = False), the node images do not appear on the chart. |
|
PSIMAGEVER |
A unique number that is assigned to each image. This is a system-maintained value. |
|
PTDESCR_UNDER_IMG |
If you are using a node display template, this specifies the first node line number that appears under the node image. The specified line number and all following lines appear below the image. All lines prior to the specified line appear to the side of the image. If you are not using a node display template, specify an integer from 1 to 7. The corresponding descriptor and all following descriptors appear below the image. All descriptors prior to the one specified appear to the side of the image. If no value is specified, the node lines all appear to the side. If no image is displayed, this field is ignored. This field takes an integer value. |
|
PTPHOTO_START |
Specifies the node line number on which the photo starts. This field only applies if you are using a node display template. |
|
PTNODE_DISPLAY_ID |
Specifies which display template ID to use with this node. |
|
PTCHART_SCHEMA_ID |
Specifies the current schema value. The system sets this value using the ChartCurrentSchemaLevel OrgChart property value. When the user selects a different schema value, the system sets field to the new value, sets the ChartCurrentSchemaLevel OrgChart property value to the new value, and redraws the chart using the new schema level. If the application changes the ChartCurrentSchemaLevel OrgChart property value, the system sets this field to the new value and redraws the chart using the new schema level. |
PTORGPOPUP_SBR
This table describes the fields in PTORGPOPUP_SBR.
|
Field |
Description |
|---|---|
|
PTCHART_NODE |
Specifies the name of the node that invoked this pop-up chart. This is a key field. |
|
PT_POP_UP_ID |
The unique ID for the pop-up. This is a key field. |
|
PTPREDECESSOR_NODE |
Specifies the name of the predecessor node to the current chart node. The predecessor node is the node that invoked this node. Your application PeopleCode must set this value when the link is clicked on the predecessor node. |
|
PTND_DISPLAY_ORDER |
Sets the display order of the nodes within the same pop-up. By default the nodes are ordered as they appear in the rowset. |
|
PTNDMAINICON_IMAGE |
Specifies the main icon image name for the node. |
|
PTNODESTYLENAME |
Specifies the style class name for the node to control node background color, border, style, and so on. If no style class name is specified the PeopleTools default style class is used. |
|
PT_POPUP_PARENT_ID |
Set to the ID of the parent pop-up chart to which the PT_POP_UP_ID is attached. If the chart ID PT_POP_UP_ID is connected from the organization node, then its corresponding PT_POPUP_PARENT_ID value is NULL. |
|
PTHASPOPUP_FLAG |
Indicates whether the node has a pop-up. Y – This node has a link that invokes a pop-up and the data for the pop-up is already loaded into the pop-up node rowset. X – This node has a link that invokes a pop-up and the data for the pop-up is not loaded in the rowset. The data will be loaded on demand. N – This node does not have a link to invoke a pop-up chart. The default value is “N”. |
|
PTPOPUPEXPAND_FLAG |
Indicates whether a node’s pop-up nodes display. Y – Pop-up nodes display. N – No pop-up nodes display. If the user clicks the close icon in the pop-up node, the FieldChange event for PTPOPUPEXPAND_FLAG executes. The application sets the value of PTPOPUPEXPAND_FLAG to “N” when the pop-up node is closed. |
|
DISPLAYED_FLAG |
Indicates whether the node will appear in the pop-up chart. Y = The node appears in the pop-up chart. N = The node never appears in the pop-up chart, including its pop-up nodes. Default is “Y”. |
|
PTNODE_DESCRn |
Specifies the descriptor n of the node, where n is an integer from 1 to 8; for example, PTNODE_DESCR2. Maximum length is 50 characters. |
|
PTNDDESCnLINKABLE |
Specifies whether the descriptor n is linkable, where n is an integer from 1 to 8; for example, PTNDDESC2LINKABLE. Y – Linkable N – Not linkable |
|
PTDESCRn_ICON_IMG |
Specifies the name of the image associated with descriptor n, where n is an integer from 1 to 8; for example, PTDESCR2_ICON_IMG. |
|
PTDESCRn_ICON_POS |
Indicates the position of the icon relative to descriptor n, where n is an integer from 1 to 8; for example, PTDESCR2_ICON_POS. L – To the left of the description. R – To the right of the description. The default value is based on user language. For instance, “L” for English and “R” for Hebrew. |
|
PTADJUSTFORNULLS |
Indicates whether to collapse empty attributes to conserve vertical space within the nodes. Y – Collapse N – Do not collapse |
|
PTPOPUPHDRMAINDESC |
Specifies the main descriptor of the pop-up chart header for this node. |
|
PTPOPUPHDRMAINICON |
Specifies the name of the image to place on the top left of the pop-up chart header. |
PTORGCRMB_SBR
This table describes the fields in PTORGCRMB_SBR:
|
Field |
Description |
|---|---|
|
PTORGCRMBID |
Assigns the breadcrumb ID. PTORGCRMBID is a key field. |
|
PTPARENT_ORGCRMBID |
Specifies the breadcrumb ID of Parent node. Only one row, which will be the first breadcrumb, can have this field blank or there will be a runtime error. |
|
PTORGCRMBDESCR |
Sets the breadcrumb description. In an organization chart this is generally a name. |
|
DISPLAYED_FLAG |
The displayed flag, Y = Displayed. N = Not displayed. The default is “N”. |
|
PTORGCRMBLINKABLE |
The linkable flag. Y = Linkable N = Not linkable The default is “Y”. |
PTORGBOXLST_SBR
This table describes the fields in PTORGBOXLST_SBR:
|
Field |
Description |
|---|---|
|
PTDESCR_DRPDWN_ID |
Specifies the node description drop-down list box ID. PTDESCR_DRPDWN_ID is a key field. |
|
PTORGDRPLSTITM_ID |
The drop down list item ID for the specified drop down list. PTORGDRPLSTITM_ID is a key field. |
|
PTORGDRPLS_GRP_ID |
Specify the group ID for the drop down list item in the drop-down box. For a folder menu, set this value to the list item ID (PTORGDRPLSTITM_ID) of the parent folder. For a top-level folder, set this value to blank. For a flat (single-level) drop-down list box, set this value to blank. |
|
PTND_DISPLAY_ORDER |
Set the display order of the list item within the same dropdown box. By default, the list will display in the order the list items appear in the rowset. |
|
PTNODELISTDESCR |
The text that will appear for the drop down list item. The maximum length is 60 characters. |
|
PTORGLISTDESCSTYLE |
Specify the style class for the list item. The default style class for drop down list items depends on the type of drop down. |
PTORGBOXFLD_SBR
This table describes the fields in PTORGBOXFLD_SBR:
Note: This subrecord is retained for backward compatibility. With PeopleTools version 8.52 and later, Oracle recommends using node display templates. The PTORGBOXFLD_SBR is not used with a chart that implements node display templates.
See Configuring the Node Record for Drop-Downs.
|
Field |
Description |
|---|---|
|
PTDESCRn_DROPDOWN |
The drop down list ID for descriptor n, where n is an integer from 1 to 7; for example, PTDESCR2_DROPDOWN. |
|
PTDESn_SLCT_ITM_ID |
The selected list Item ID in the drop-down box for descriptor n, where n is an integer from 1 to 7; for example, PTDES2_SLCT_ITM_ID. The system sets this field to the value of the list item ID when the user clicks on a list item in the drop-down list box for descriptor n. You can add PeopleCode to the PTNODE_DESCRn field that performs business logic using the value in this field. |
PTORGIM_SBR
This table describes the fields in PTORGIM_SBR:
|
Field |
Description |
|---|---|
|
PTCHART_NODE |
Specifies the node name. This is a key field. |
|
MCF_IMUSERID |
Specifies the user ID used to get presence information for the user. This is a key field. Note: Using the PTORGIM_SBR record structure, you can configure multiple IM user IDs for a node. PeopleTools 8.52 organization chart IM feature does not support multiple presences. If more than one IM user ID is defined for a node, only the first one fetched is used. |
|
MCF_IM_PROTOCOL |
Specifies the instant messaging protocol. This is a key field. |
|
MCFIMDOMAIN |
Specifies the instant messaging domain. This is a key field. |
|
MCF_IMUSERANDNET |
Specifies the data hint text on mouse over the IM status icon. |
PTNODE_DISP_SBR
This table describes the fields in PTNODE_DISP_SBR:
|
Field |
Description |
|---|---|
|
PTNODE_DISPLAY_ID |
Specifies the ID of a display template. The PTNODE_DISPLAY_ID field on the organization chart node record specifies the node display template to be used for the node. |
|
PT_SCHEMA_LEVEL_ID |
Specifies the schema level. Specify a numeric value 1-10. |
|
PT_CNT_ID |
Specifies the descriptor. For example, PTNODE_DESCR1. |
|
PT_NODE_VIEW |
Specifies the name of the node view. |
|
PT_LINE_NUM |
Specifies the node line number on which the descriptor will appear. |
|
PT_DISPLAY_TYPE |
Specifies the display item type. Y - Linkable text N - Static text I - Linkable Icon O - Icon only A -Related action menu D - Linkable drop-down menu R - Read-only (non-linkable) drop-down menu L - Linkable drop-down list box M - IM icon If this field is set to “M” but no rows are defined in the PT_ORGIM_SBR for the node, no IM icon will be shown. The value in this field overrides the value in PTNDDESCnLINKABLE in the organization chart node record. |
|
PT_DISPLAY_FLAG |
Specifies whether the descriptor will be displayed in the node. The default value is “Y”. |
|
PTND_DISPLAY_ORDER |
Sets the display order of the descriptor/icon within the line number. |
|
PT_PADDING_RIGHT |
Specifies the padding, in pixels, to the right of the descriptor. If PT_COL_ALIGN is set to centered or left aligned, this field is ignored. |
|
PT_PADDING_LEFT |
Specifies the padding, in pixels, to maintain to the left of the descriptor. If PT_COL_ALIGN is set to centered or right aligned, this field is ignored. |
|
PT_CNT_STYLE |
Specifies the style class name that will be used to control the style of the descriptor. The default style class for drop downs depends on the type of drop down. |
|
PT_DESCR_MAX |
Specifies the maximum length for the descriptor. If the full descriptor text is longer than PT_DESCR_MAX, then an ellipsis (“…”) is appended to the displayed text. The entire text appears in a data hint. The default value is 50 characters. This value overrides any value set in the NodeMaxDisplayDescLength OrgChart property. |
At a minimum, these methods are needed to create an organization chart:
SetNodeData
SetNodeRecord
These methods are required if your organization chart uses pop-ups:
SetPopUpNodeData
SetPopUpNodeRecord
These methods and properties are required if your organization chart uses IM presence:
SetIMRecord
SetIMData
IMPresence
These methods are required if your organization chart uses node display templates:
SetNodeDisplayDataRecord
SetNodeDisplayData
These methods and properties are required if your organization chart uses zooming schemas:
SetSchemaLevels
ChartCurrentSchemaLevel
ID SchemaLevel class property
ImageHeight SchemaLevel class property
These methods are required if your organization chart uses breadcrumbs:
SetCrumbData
SetCrumbRecord
These methods are required if your organization chart uses drop-down list boxes:
SetDropdownData
SetDropdownRecord
Chart objects are declared using the Chart data type. For example,
Local OrgChart &MyOrgChart;A chart object can be instantiated only from PeopleCode.
You can use this object only in PeopleCode programs that are associated with an online process, not in an Application Engine program, a message notification, a Component Interface, and so on.