Creating Composite Query Pivot Grid Models Using the Pivot Grid Wizard
Composite Query enables you to combine data from existing queries and then to apply filters, aggregates, and so on before presenting the report results, which show the combined data set. Composite Query retrieves multiple levels of related information about existing queries and presents the combined data as a single, flattened query result.
Using Pivot Grid wizard, you are able to associate composites queries, PSQueries, and components as the data sources when you create Pivot Grid models. The steps used to create composite query Pivot Grid models are similar to the steps used to create PSQuery or component Pivot Grid models.
To create a composite query Pivot Grid model using Pivot Grid wizard:
From the Main Menu, select .
Select the Add a New Value tab to create a new Pivot Grid model.
Enter the Pivot Grid name and click the Add button to display the Specify Pivot Grid Properties page.
Use the Specify Pivot Grid Properties page (PTPG_WIZ_INFO) to identify and categorize the data model for the Pivot Grid. See Specifying Pivot Grid Properties.
Use the Select Data Source (PTPG_WIZ_DATASRC) page to select the data source and output columns.
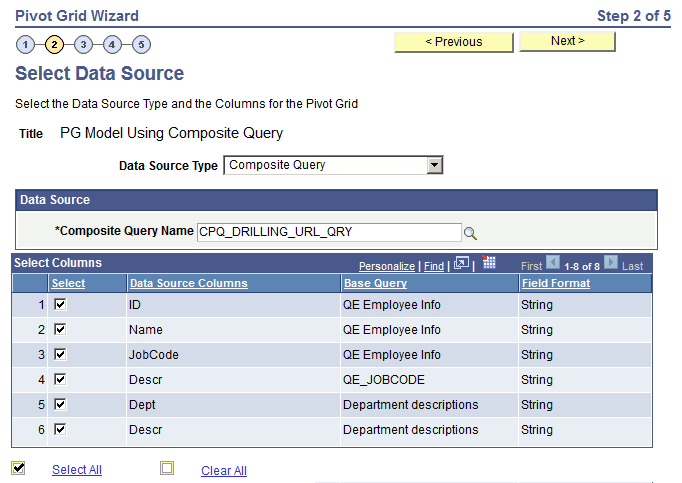
In the Select Data Source page, select the Composite Query option from the Data Source Type drop-down list.
Image: Select Data Source page with the Data Source Type set to Composite Query
This example illustrates the fields and controls on the Select Data Source page with the Data Source Type set to Composite Query. Definitions for the fields and controls appear following the example.
Field or Control
Definition
Composite Query Name This field is available if the Data Source Type is set to Composite Query.
Click the search icon to select a composite query from the list of existing composite queries.
Note: Only one composite query can be associated with one Pivot Grid model as a data source.
Select Columns Select the output columns to be plotted in the Pivot Grid model.
Note: The Select Columns region is available after you select an existing composite query in the Composite Query Name field using the search icon or after you enter a valid query name and tab out of the Composite Query Name field.
You must select at least two data source columns.
Base Query This column displays the descriptions of the underlying base query that correspond to each field in the Data Source Columns column.
If the base query has no description, the system displays the name of the base query.
Next Click this button to advance the wizard to the next page.
Note: The Next button is available after you select at least two columns in the Select Columns region.
Use the Specify Data Model Values page, define the column type, aggregate functions, and so on for the selected data model. See Specifying Data Model Values.
Use the Specify Data Model Options page to define the initial layout of the grid and the chart. See Specifying Data Model Options.
Use the Pivot Grid Display page to:
Review the Pivot Grid model based on the display options and layouts selected.
Modify the Pivot Grid model to finalize the design.
Save the model using the Save button.