Using Facets in the Fluid View
Pivot Grid filter dimensions appear as facets in the left panel of the fluid viewer. The facets:
Show the corresponding results with the total number of results or the facet value between brackets.
Include the chart X-axis, series, and the grid rows by default.
Apply progressive filtering.
Allow to filter data which reflects on the chart and the grid.
Include mini chart facets, single-select filters, or multi-select filters.
Sort data on the facets using the Facet Sort icon at the top-right of each facet. Sorting is available for all data types, including the formatted fields that are set to Date Time field format. However, sorting for tree values in facets is not available.
Follow incremental loading where only limited facet rows show initially. You must click More link to load more facets.
See, Fluid Mode Options to know more about configuring facets.
On a fluid view you can access the Options Menu to update filters. See, Using the Options Menu.
When you are using the facets consider:
For all mini chart facets, use the toggle icon at the lower-left of each facet to switch that facet view between the chart view and the list view. You can also select a data point in the facet chart to apply the facet value and filter the pivot grid data.
For single-select facets, applying the second facet value replaces the previous facet value selection for that dimension and the chart shows only the selected data point.
For multi-select facets, the selections are applied on top of the previous selections.
Oracle PeopleSoft recommends that you use multi-select with facet charts.
Image: Single-select facet
This example illustrates a single-select facet with counts.
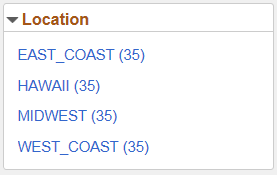
Image: Multi-select facet
This example illustrates a multi-select facet that is sorted based on the count of each item. You can click the sort icon at the top-right of the facet to sort the facet values in ascending or descending order. The facet initially display the first ten values and you can click the More link to incrementally load more facet values.
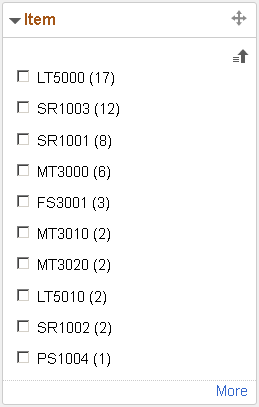
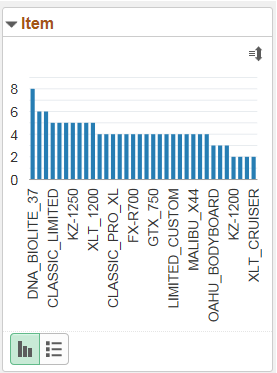
Image: Mini chart facet
This example illustrates a mini bar chart facet. You can click the sort icon at the top-right of the facet to sort the facet values in ascending or descending order.
You can also toggle between chart view and list view using the bottom left buttons.