Schedule Assessment Section
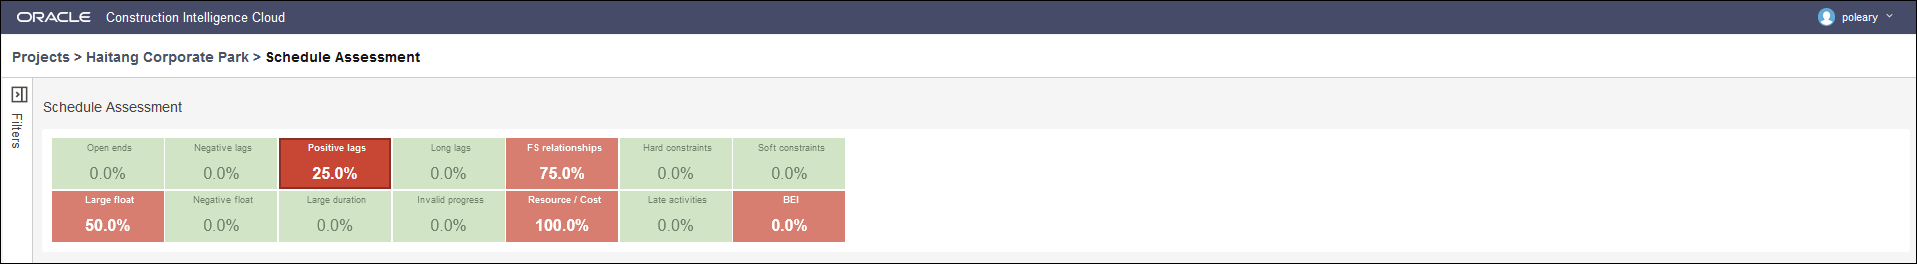
In the Schedule Assessment section, the following information displays in each tile:
- the percentage of activities that are contribute towards each metric. For example, 12.5% of all activities contribute towards the metric, activities with open ends.
- the extent of deviation from the set threshold level of each metric. For example, +7.5% above threshold
- The tile color indicates the (green or amber) indicates the overall health status of the metric.
Each activity is displayed with a link that allows you to look up the activity in P6 EPPM and make changes.
In the above example, select the Positive Lags tile to view a list of activities that resulted in a positive lag of 25%.
Related Topics
Last Published Tuesday, December 24, 2024