Project and Activity Comparison Table
Select a metric in the primary or secondary tiles to compare metrics of your current project (displayed in blue). On the Benchmarking page, click on any of the metrics to do an activity level comparison of your projects with other projects or with the projects in the benchmark groups. The columns in the activity comparison table appear according to the metrics clicked on the Benchmarking page. These include:
- Project: The current project name or the benchmark group with the number of projects included in each group. For example, NabooProjects, 6 projects.
Expand or collapse a benchmark group to drill-down to view the included projects that you can access to, and the activities within each project.
- Activity: The total number of activities of each project.
For your current project, a maximum of three activities display for comparison.
For a benchmark group, it is the aggregate of all activities in the included projects.
- Planned duration: The total working time from the project planned start date to the planned finish date.
- Actual duration: The total working time from the activity Actual Start date to the Actual Finish date for completed activities, or the total working time from the Actual Start date to the data date for in-progress activities.
- Actual delay: The actual delay of a project is calculated as follows:
- If a baseline exists:
For not started activities, Actual delay = Planned Finish Date - Baseline Project Finish
For in-progress activities, Actual delay = Remaining early finish date - Baseline Project Finish
For completed activities, Actual delay = Actual Finish Date - Baseline Project Finish
- If a baseline does not exist:
For not started activities, Actual delay = Planned Finish Date - Planned Project Finish
For in-progress activities, Actual delay = Remaining early finish date - Planned Project Finish
For completed activities, Actual delay = Actual Finish Date - Planned Project Finish
- If a baseline exists:
- Total float: The amount of time the activity can be delayed before risking a delay to the project finish date.
- Actual total units: The sum of the actual non-overtime and overtime units associated with the activity
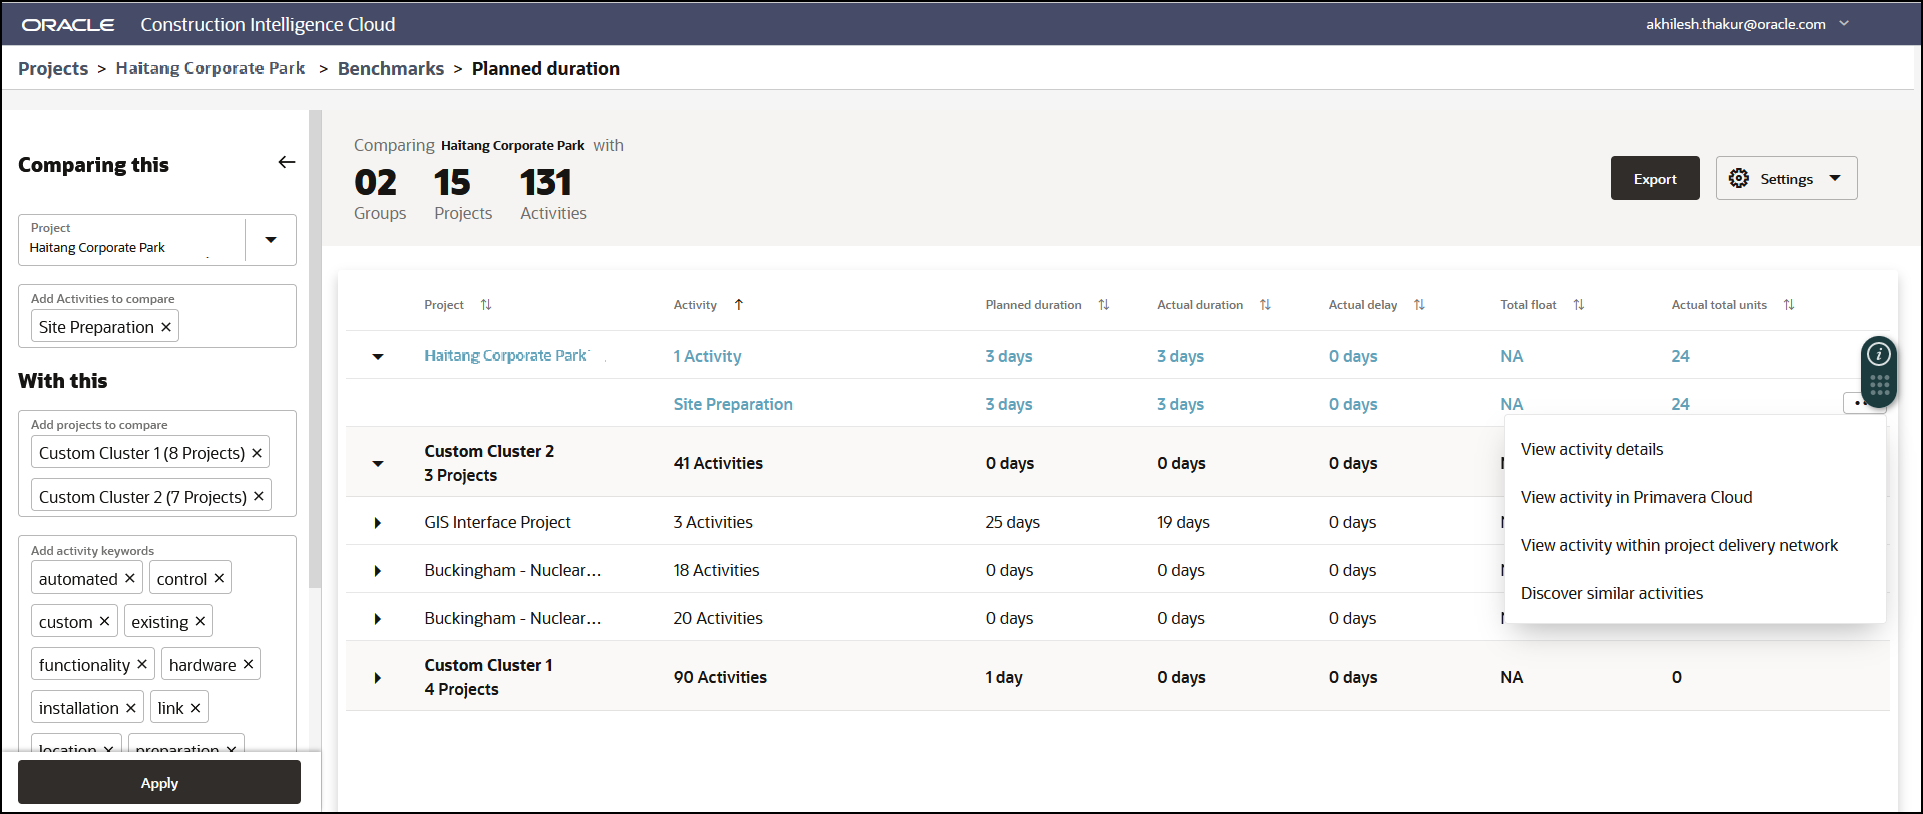
For each activity, click on the Overflow Menu ![]() and select any of the following links:
and select any of the following links:
- View activity details
- View activity in P6 or View activity in Oracle Primavera Cloud
- View activity within project delivery network
- Discover similar activities
This link is enabled only for the activities in your current project. Using natural language processing (NLP) techniques, it displays only those benchmark activities that are similar to activity selected in your current project (as shown above).
Select any of the following buttons to perform the following actions:
- Click Settings to customize the columns displayed in the activity table as follows:
- Use the slider to hide or display a column.
- Click and drag a column vertically to reorder the column sequence in the table.
- Click Export and save the activities in an Excel spreadsheet file (.xls or .xlsx).
Note: The export file contains the complete list of activities that satisfy the filter criteria whereas only a maximum of 10 activities from your current project are displayed in the activity comparison table above.
Related Topics
Last Published Tuesday, December 24, 2024