Benchmarking Page - New!
How to Get Here
- Sign in to CIC Advisor.
- On the Project Listings page, select the Predicted delay likelihood KPI of a project.
- On the Schedule Intelligence page, click Try the new benchmarks in the Compare this project section.
How to Use this Page
The Benchmarking page allows you to compare your ongoing projects against projects that have been completed or are 80- 90% complete to:
- learn from past delays, gains and schedule issues on projects and apply those learnings to the current project
- enhance estimation capabilities
- rank your current project in comparison to the projects in the benchmark groups
- compare your project's activities with the activities of the benchmark projects
- expand or collapse projects to adjust your level of granularity as needed
Note: The groups being compared are setup in the CIC Advisor Administration application, and can be modified according to the needs of your organization. To change a group or modify the selection of projects in each group, contact your CIC Advisor administrator.
This page includes the following sections:
Section Number | Description |
|---|---|
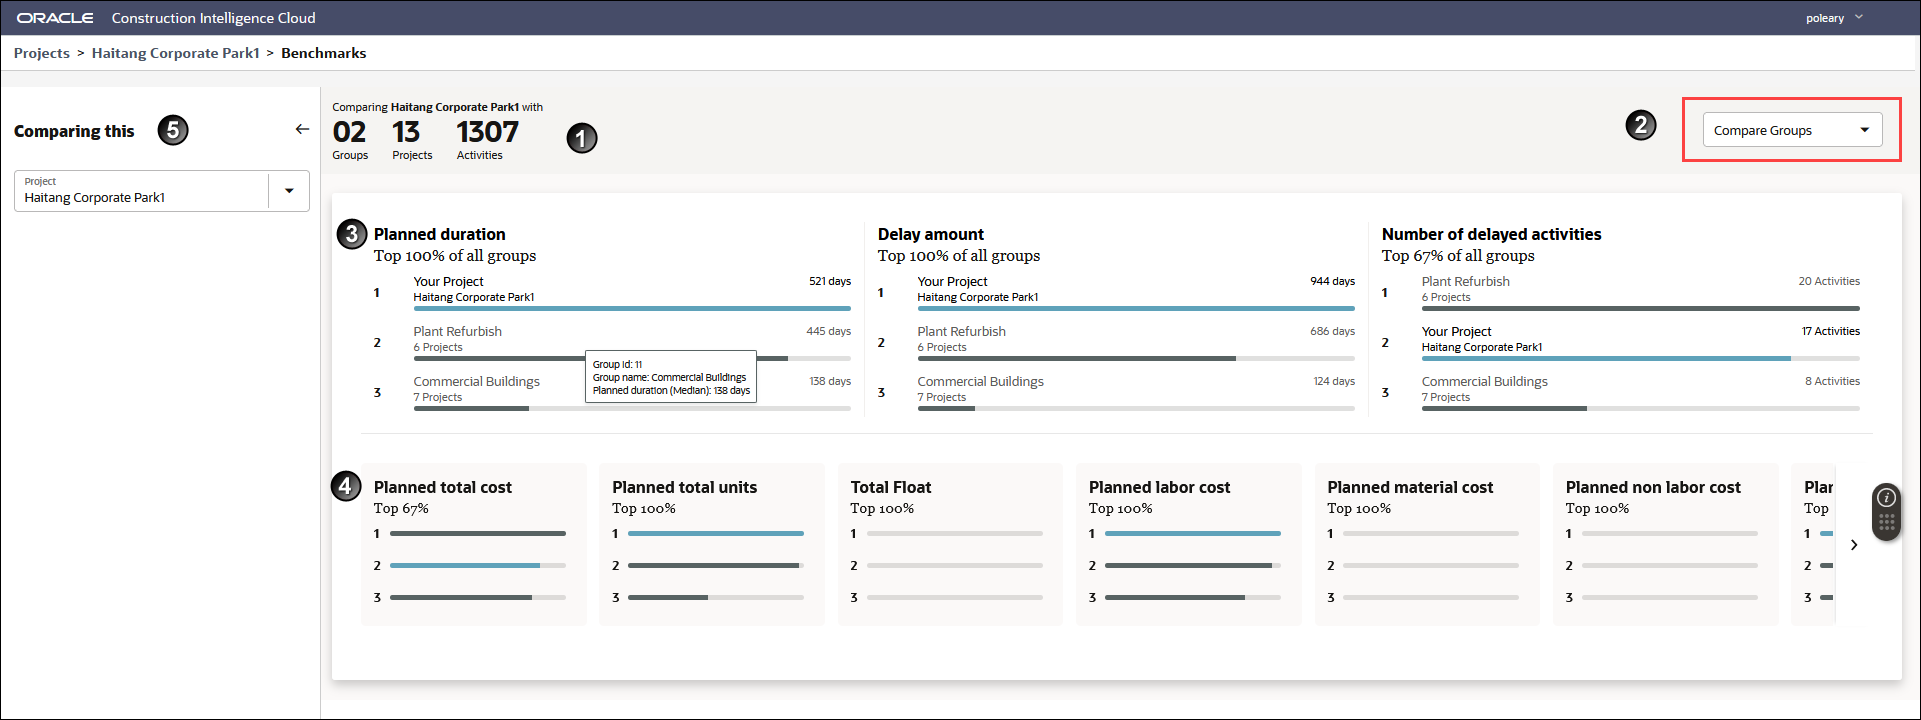
1 | Provides a total count of the benchmark groups, projects and the activities with which your current project is being compared. In the above example, Haitang Project is compared with 2 benchmark groups, 13 projects and 1307 activities. |
2 | Compare Options: Select any of the following options to compare your project:
|
3 | Main Metrics Section Depending on your project's ranking in comparison with other projects or benchmark groups, compares your project on the following metrics:
Note: You can also interchange the above metrics with any of the secondary metrics (click and drag) based on your organization's needs. |
4 | Secondary Metrics Section Compare your project (displayed first in each tile) with the benchmark groups / projects on the following metrics:
Note: You can also interchange the above metrics with any of the primary metrics (click and drag) based on your organization's needs. |
5 | Filters Section Select an alternative project and click Apply to compare it with the benchmark groups/projects. For more details, see Filters Pane of the New Benchmarking Page. |
Click More details to access the Benchmarking Details Page.
Related Topics
Last Published Tuesday, December 24, 2024