Benchmarking Page
How to Get Here
- Sign in to CIC Advisor.
- On the Project Listings page, select the Predicted delay likelihood KPI of a project.
- On the Schedule Intelligence page, click Compare in detail in the Compare this project section.
How to Use this Page
The Benchmarking page allows you to compare your ongoing projects against projects that have been completed or are 80- 90% complete to:
- learn from past delays, gains and schedule issues on projects and apply those learnings to the current project
- enhance estimation capabilities
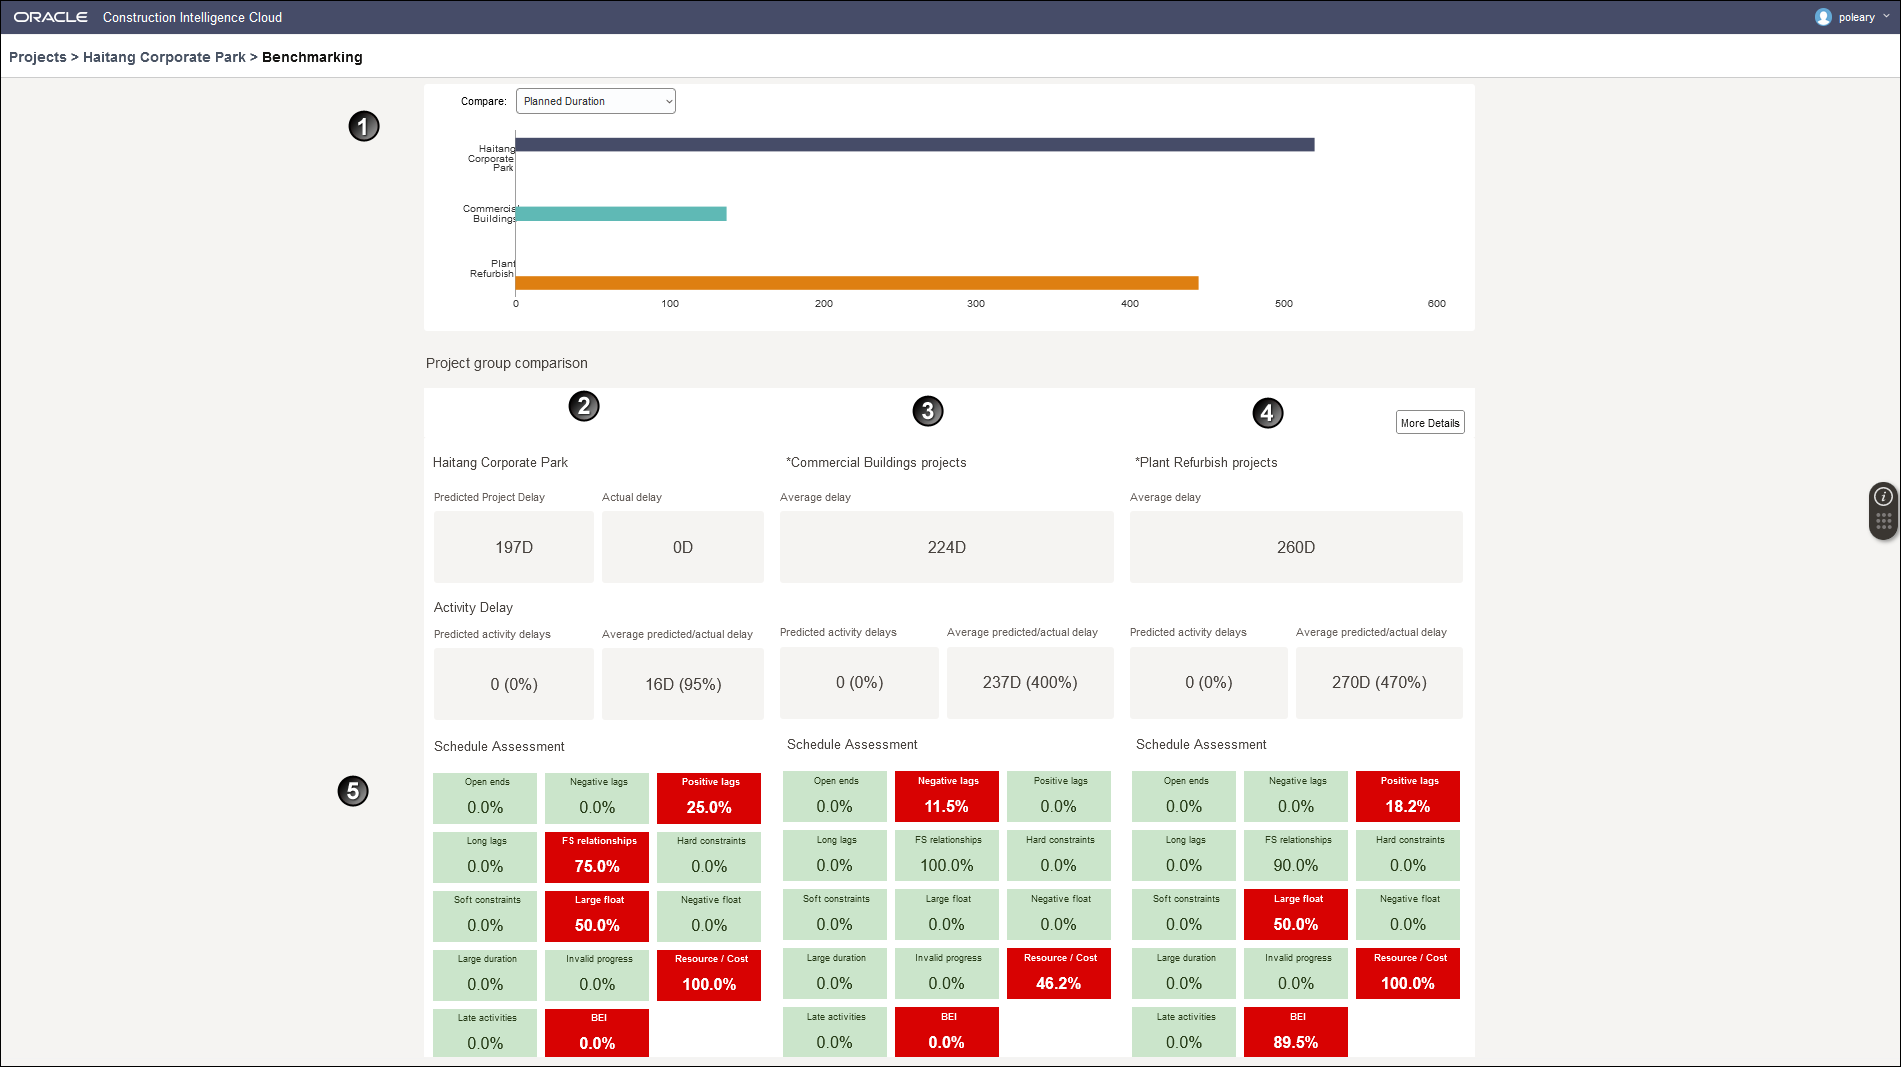
The horizontal bar chart displays compares the ongoing project with two benchmarked groups or completed projects.In the above bar chart, the Haitang Corporate Park project is compared with the benchmark groups, Commercial Buildings and Plant Refurbish.
Compare your project with the benchmark groups for any of the following metrics: Planned Duration, Planned Labor Units, Planned Total Cost, Planned Labor Cost, Planned Material Cost, Planned Nonlabor Cost, Planned Nonlabor Units, Planned Total Units, Total Float, and # of Delayed Activities.
- The first column displays the metrics of your project. For example, the Haitang Corporate Park project.
- The middle and the last columns display the corresponding metrics for each benchmarked group. For example, Commercial Buildings and Plant Refurbish.
Note: The groups being compared are setup in the CIC Advisor Administration application, and can be modified according to the needs of your organization. To change a group or modify the selection of projects in each group, contact your CIC Advisor administrator.
This page includes the following sections:
Section Number | Section Title |
|---|---|
1 | Benchmark Comparison Graph Section described above |
2 | |
3 and 4 | |
5 | Schedule Assessment Section of your project and benchmark groups respectively |
Click More Details to access the Benchmarking Details PageBenchmarking Details Page.
Related Topics
Last Published Tuesday, December 24, 2024