Delay Predictions Page
How to Get Here
- Sign in to CIC Advisor.
- On the Project Listings page, select the Predicted delay likelihood KPI of a project.
- On the Schedule Intelligence page, click View prediction details in the Project predictions section.
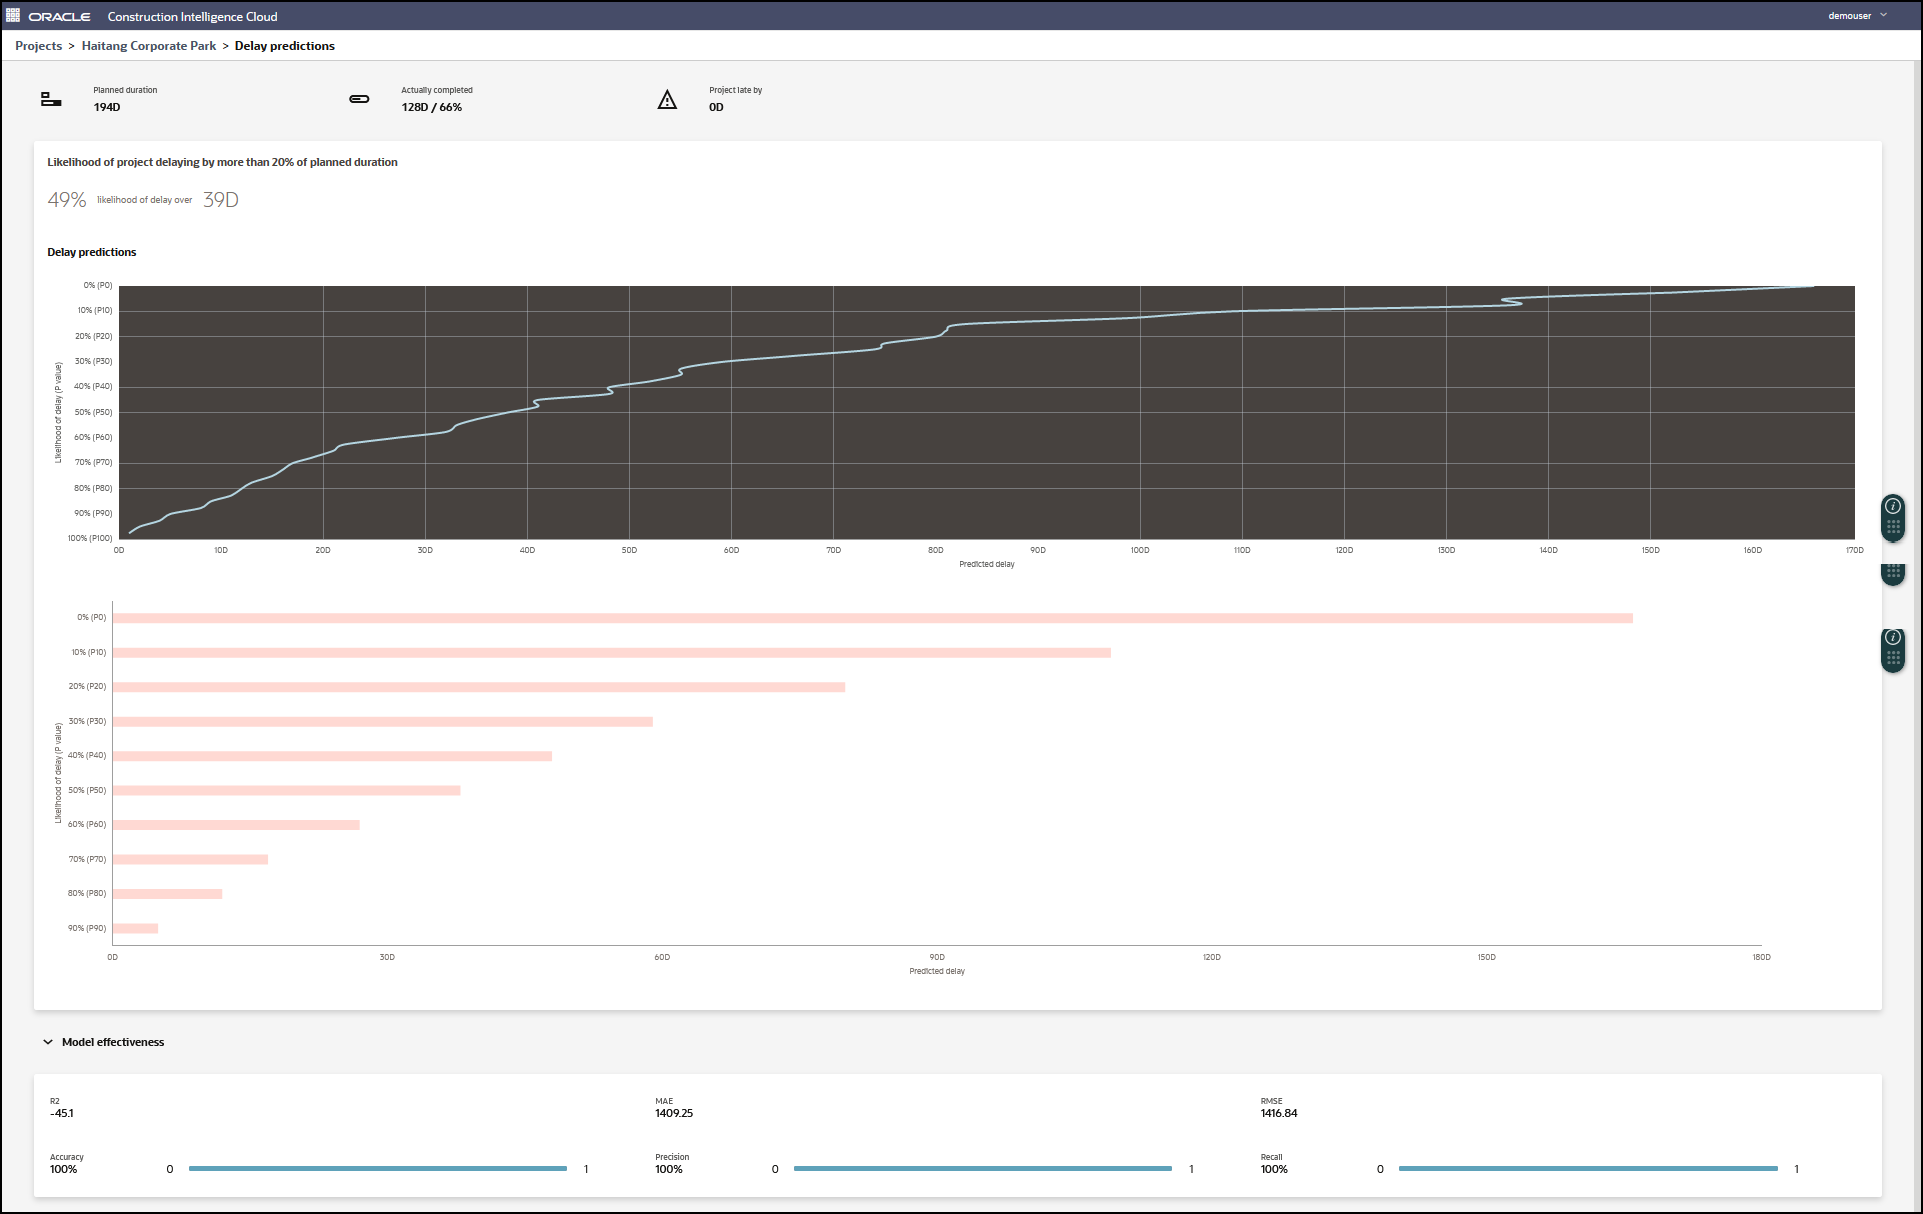
The following information is provided from the Schedule Intelligence Page to summarize the project's current status:
- Planned duration: The length of the project determined by the current project schedule. In the above example, the Planned duration is 194 days.
- Actually completed: The percentage of all completed activities in the project in terms of days and percentage.
- Project late by: The number of days the project is delayed. If the planned end date is greater than the baseline end date, then the delay is calculated as (Planned end date - Baseline end date). Otherwise it is not delayed (zero days).
- Likelihood of project delaying by more than 20% of planned duration: The probability of the project schedule exceeding 20% of the planned duration.
In the above example, the probability of the project schedule exceeding 39 days (20% of the planned duration) is 49%.
Delay Prediction Line Graph
The Delay Prediction Line Graph charts the predicted delay of the project against the corresponding probability of delay. The x-axis displays the predicted delay in number of days. The y-axis displays the likelihood of delay or the probability of delay as a percentage. In the above chart, the Haitang Corporate Park project is predicted to be delayed for more than 51 days with 50% probability.
Tip: Hover your cursor over a data point in the graph to view specific details.
Delay Prediction Bar Graph
The Delay Prediction Bar Graph predicts project delay and contrasts it with the planned duration calculated by your project schedule. The predicted and planned estimates are displayed for varying levels of probability. The x-axis displays the predicted delay quantified in terms of days. The y-axis displays the likelihood of delay or the probability of delay as a percentage.
In the above bar chart, the Haitang Corporate Park project is predicted to be delayed for more than 51 days with 50% probability.
Tip: Hover the cursor over a specific bar in the graph to view specific details.
Model effectiveness
The Model effectiveness section provides a few training metrics for robustness and accuracy of the machine learning (ML) model that is being used to predict the Key factors information for the project. These include:
- R2: It measures the proximity of the data points to the fitted regression line. The higher the R2 score, the better. It is calculated as: Explained Variation / Total Variation.
- MAE: The Mean Absolute Error (MAE) measures the average magnitude of the error in the set of predictions without considering the direction. The lower the score, the better.
- RMSE: The Root Mean Square Error (RMSE) measures the average magnitude of the error. It's the square root of the average of the squared difference between predictions and actual observations. The lower the score, the better.
- Accuracy: The ratio of correct predictions to the total number of predictions.
- Precision: The frequency of being correct with a positive prediction, and how many are actually delayed out of all the risks that are predicted to be delayed.
- Recall: The ability of a model to find all the positive results actually in the data. It Of all the activities that are actually delayed, how many the model correctly identified.
Related Topics
Last Published Tuesday, December 24, 2024