This Activity in the Project Network Diagram Section
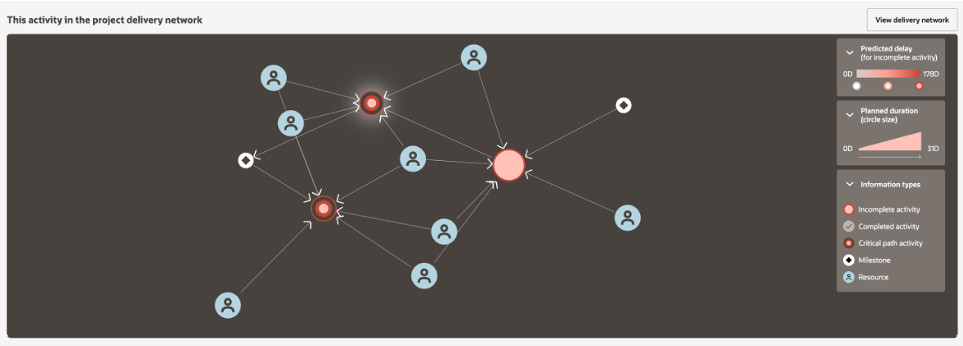
This Activity in the Project Network Diagram displays a network of activities and resources that are directly impacted by this activity. Each node represents an activity(![]() ) or Resource (
) or Resource (![]() ). The size of an activity node represents the planned duration (large, medium, or small). The color intensity of an activity indicates the extent of predicted delay for that activity where:
). The size of an activity node represents the planned duration (large, medium, or small). The color intensity of an activity indicates the extent of predicted delay for that activity where:
- Grey indicates no delay (delay metric value = 0)
- Amber indicates medium predicted delay (30<= delay metric >= 70)
- Red indicates a large predicted delay (delay metric value > 70)
Click on a specific node (activity) in the network diagram to view the Successor activities, Predecessor activities, and the Actions tab associated with that activity
Related Topics
Last Published Tuesday, December 24, 2024