Working with Reporting Metrics Pagelets
This topic discusses how to view and work with pagelets used for reporting metrics.
|
Page Name |
Definition Name |
Usage |
|---|---|---|
|
IT_PE_FIN_STAT |
Review a snapshot of enterprise IT asset current valuation. |
|
|
IT_PE_UNDISC |
Review data and graphic representation of the devices that have failed to report an inventory within a specified time period, allowing managers to investigate the absences. |
|
|
IT_HRDWR_SUM |
Count all IT hardware–by subtype–that appears in the third-party and asset repository databases. View a summary count and graphic representation of IT hardware that appears in one database but not the other. |
|
|
IT_PRGS_HWC |
Review up-to-date results of IT asset change or upgrade initiatives. |
|
|
IT_LOAD_ERR_SUM |
Review summarized totals and graphic representation of the data mapping errors that are encountered during integration of staged data from third-party discovery suppliers. |
|
|
IT_PE_INV_EXCEPT |
Review a summary of the differences between the Asset Repository and the third-party database. |
|
|
AM_LEASE_SUM |
Review IT-related leases that will expire within the next n days. Drill down to the assets associated with the leases. |
|
|
IT_PE_THIRDLINK |
Link to frequently accessed URLs. |
|
|
IT_PE_SWDG_SUM |
Review the installed software licenses versus serial ID-based authorized software licenses. An alert displays when installed software licenses exceed the number authorized. |
|
|
IT_SFTWR_INV |
Review the counts of total licenses versus installed licenses, the counts for authorized and unauthorized users. |
|
|
IT_SFTWR_PEND |
Review a list and graphic representation of software licenses that the company must acquire to keep the enterprise in compliance. |
|
|
IT_PRGS_SWC |
Review the up-to-date results of IT asset change or upgrade initiatives. |
|
|
IT_SFTWR_RENEW |
Review the alerts to the IT Asset Manager when a contract needs to be renewed or renegotiated. |
Use the Asset Financial Statistics pagelet (IT_PE_FIN_STAT) to review a snapshot of enterprise IT asset current valuation.
Navigation:
Click the Personalize Content link on the PeopleSoft Home page.
Select Asset Financial Statistics.
This example illustrates the fields and controls on the Asset Financial Statistics pagelet. You can find definitions for the fields and controls later on this page.

Field or Control |
Description |
|---|---|
Avg Life Remaining (average life remaining) |
Displays a value that is calculated based on the following algorithm: Sum of (Useful life – Life to Date life) / Quantity of assets with useful life available. Depending upon the depreciation method, some assets may not have a useful life attached. In those cases, the asset will not be computed for the algorithm. If quantity equals zero, a not applicable (N/A) legend will appear on that field. |
Year to Date Depreciation |
Displays the algebraic addition of all the assets to be included in the statistics. |
Units |
Displays the algebraic addition of quantity field for every asset ID to be included in the statistics. |
Net Book Value |
Displays the algebraic addition of net book value for every asset to be included in the statistics. |
Use the Assets Not Reporting pagelet (IT_PE_UNDISC) to review data and graphic representation of the devices that have failed to report an inventory within a specified time period, allowing managers to investigate the absences.
Navigation:
Click the Personalize Content link on the PeopleSoft Home page.
Select Assets Not Reporting.
This example illustrates the fields and controls on the Assets Not Reporting pagelet. You can find definitions for the fields and controls later on this page.
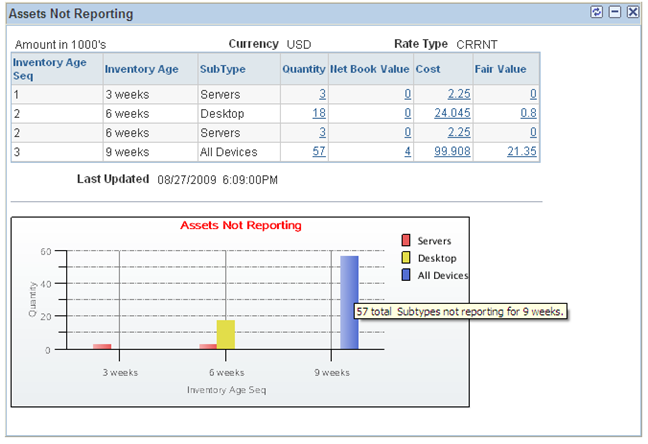
The Assets Not Reporting portal pagelet provides counts of reporting failures for each type of device. It also includes the Assets Not Reporting bar chart of the data.
Field or Control |
Description |
|---|---|
Quantity |
Displays the number of assets by subtype that are not reporting. Click the link to drill back to the Assets Not Reporting page and review the assets. |
Net Book Value, Cost, and Fair Value |
Displays the financial information for financial assets. Click the links to access the Assets Not Reporting page. Note: The columns for Net Book Value, Cost and Fair Value display on the pagelet only when Financial Impact is enabled on the Installation Options - Asset Management page and when the columns are selected for viewing in User Preferences for a given user. Also select the rounding amount for those values within User Preferences. A user may select to see one, two or all three of the columns. The aggregate values displayed in these three columns apply to only the financial assets that are included in the total number of exceptions, even though the number of exceptions includes both financial and nonfinancial assets. |
Assets Not Reporting (bar chart) |
Included at the bottom of the pagelet. Mouse over the graph to view the number of assets that are not reporting accompanied by the description for each category. The bars are based on the column quantity from the record. |
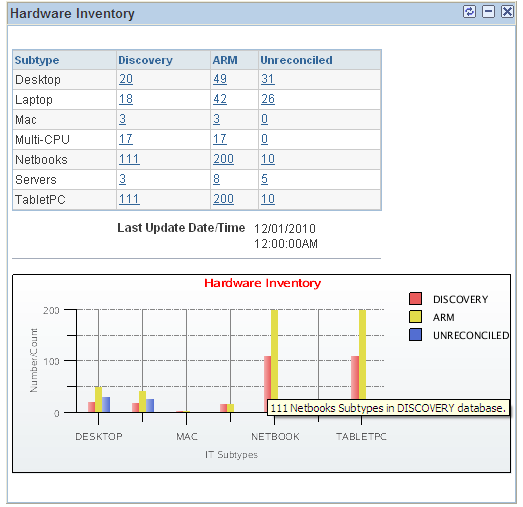
Use the Hardware Inventory pagelet (IT_HRDWR_SUM) to count all IT hardware–by subtype–that appears in the third-party and asset repository databases.
View a summary count and graphic representation of IT hardware that appears in one database but not the other.
Navigation:
Click the Personalize Content link on the PeopleSoft Home page.
Select Hardware Inventory.
This example illustrates the fields and controls on the Hardware Inventory pagelet. You can find definitions for the fields and controls later on this page.
Field or Control |
Description |
|---|---|
Discovery |
Displays the number of assets per subtype found in the third-party database. Click the link to access the Hardware Inventory page. On the Hardware Inventory page, the system populates the IT Subtype with the link value that you clicked in the pagelet. The system enters Discovery DB as the Source Database. |
ARM |
Displays the number of assets per subtype found in the asset repository. Click the link to access the Hardware Inventory page. On the Hardware Inventory page, the system populates the IT Subtype with the link value that you clicked in the pagelet. The system enters Asset Repository as the Source Database. |
Unreconciled |
The Unreconciled Assets column contains the combined count of those assets that exist in only one of the databases—third-party or the asset repository. The system displays the number of assets per subtype that are found in only one database. Click the link to access the Hardware Inventory page. On the Hardware Inventory page, the system populates the IT Subtype with the link value that you clicked in the pagelet. The system enters Both ARM and Discovery as the Source Database. Note that it changes the operator to <> (not equal.) The query returns those assets NOT in ARM ADDED TO the assets NOT in Discovery. |
Hardware Inventory (bar chart) |
The Hardware Inventory pagelet includes the Hardware Inventory bar chart, which displays the number of assets from Discovery, ARM, and Unreconciled for each Subtype. Mouse over the graph and view the number and description for each Subtype. |
Use the Hardware Progress Report pagelet (IT_PRGS_HWC) to review up-to-date results of IT asset change or upgrade initiatives.
Navigation:
Click the Personalize Content link on the PeopleSoft Home page.
Select Hardware Progress Report.
This example illustrates the fields and controls on the Hardware Progress Report pagelet. You can find definitions for the fields and controls later on this page.

Field or Control |
Description |
|---|---|
Report |
Defines which template (a container for report parameters) drives this line of data. |
Target |
Displays the total number of expected actions at the outset of a project such as the count of machines that meet the criteria. This number is generated when the report is run for the first time. |
To Do |
Displays the number of outstanding actions in a project. Click to access the Progress Report Detail page and view a list of items for a specific project. On the Progress Report Detail page, you can drill down to the details for each item in the project. |
Note: Only those hardware assets that are in physical use are analyzed and processed through the progress report.
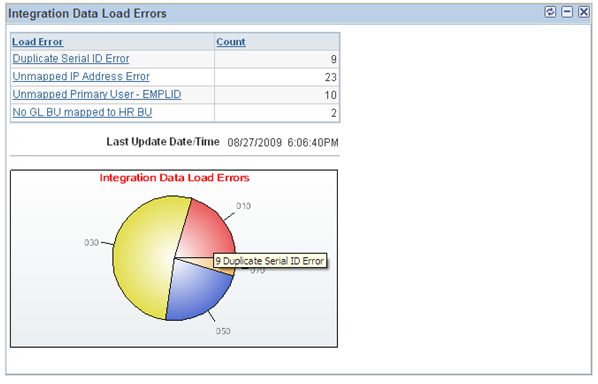
Use the Integration Data Load Errors pagelet (IT_LOAD_ERR_SUM) to review summarized totals and graphic representation of the data mapping errors that are encountered during integration of staged data from third-party discovery suppliers.
Navigation:
Click the Personalize Content link on the PeopleSoft Home page.
Select Integration Data Load Errors.
This example illustrates the fields and controls on the Integration Data Load Errors pagelet. You can find definitions for the fields and controls later on this page.
Field or Control |
Description |
|---|---|
Load Error |
Displays the summarized totals of the data mapping errors that are encountered during integration of staged data from third-party discovery suppliers. Drill down from the following links to view details on the Integration Data Load Errors page:
|
Count |
Displays the number of exceptions for each integration data load error. |
Note: It is not necessary to run the Generate Metrics process in order to produce these totals. The IT_LOAD_PROC is submitted automatically when the data is received through the integration.
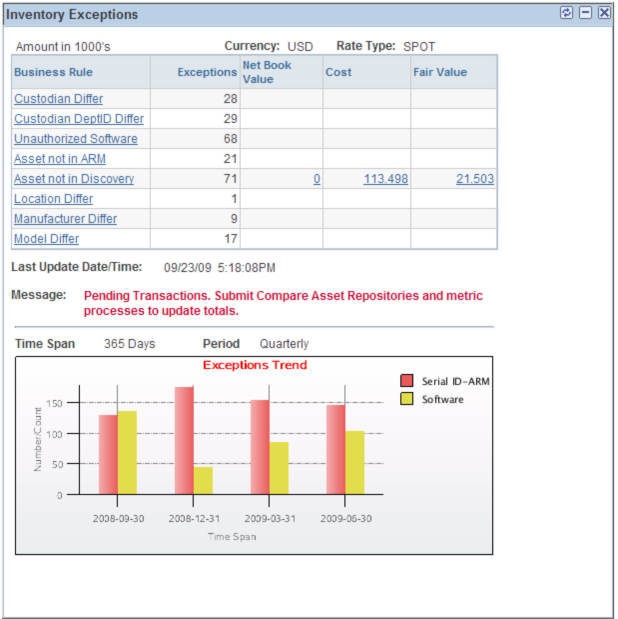
Use the Inventory Exceptions pagelet (IT_PE_INV_EXCEPT) to review a summary of the differences between the Asset Repository and the third-party database.
Navigation:
Click the Personalize Content link on the PeopleSoft Home page.
Select Inventory Exceptions.
This example illustrates the fields and controls on the Inventory Exceptions pagelet. You can find definitions for the fields and controls later on this page.
Field or Control |
Description |
|---|---|
Business Rule |
Displays each of the business rules that will generate an exception. Click the link to access the Manage Exceptions page. |
Exceptions |
Displays the number of exceptions for each business rule. |
Net Book Value |
Displays the total net book value (NBV) of the financial assets included in the exceptions for a business rule that would require a retirement to correct. Click the link to review the NBV for each financial asset from the Manage Exceptions page. |
Cost |
Displays the total cost basis of the financial assets that are included in the exceptions for a business rule that would require a retirement to correct. Click the link to review the Cost for each financial asset from the Manage Exceptions page. |
Fair Value |
Displays the total fair value (FV) of the financial assets that are included in the exceptions for a business rule that would require a retirement to correct. Click the link to review the FV for each financial asset from the Manage Exceptions page. |
Exceptions Trend (graph) |
Displays a graph of the business rule exceptions over time. See PeopleSoft IT Asset Management, Managing Exceptions, Viewing Manage Exceptions Trend. |
Note: The columns for Net Book Value, Cost and Fair Value display on the Inventory Exceptions pagelet only when Financial Impact is enabled on the Installation Options - Asset Management page and when the columns are selected for viewing in User Preferences for a given user. A user may select to see one, two or all three of the columns. The aggregate values displayed in these three columns apply to only the financial assets that are included in the total number of exceptions, even though the number of exceptions includes both financial and nonfinancial assets.
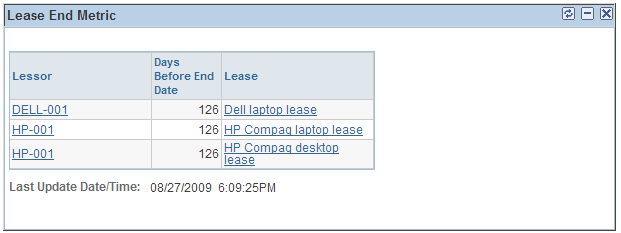
Use the Lease End Metrics pagelet (AM_LEASE_SUM) to review IT-related leases that will expire within the next n days.
Drill down to the assets associated with the leases.
Navigation:
Click the Personalize Content link on the PeopleSoft Home page.
Select Lease End Metrics.
This example illustrates the fields and controls on the Lease End Metric pagelet. You can find definitions for the fields and controls later on this page.
Field or Control |
Description |
|---|---|
Lessor |
Click the link to access the Lease Summary by Lessor page. |
Days Before End Date |
Displays the number of days before lease expiration in ascending order. |
Lease |
Click the link to access the Link Details page. |
See Working with Leases.
Use the Related Links pagelet (IT_PE_THIRDLINK) to link to frequently accessed URLs.
Navigation:
Click the Personalize Content link on the PeopleSoft Home page.
Select Related Links.
Use the Software Device Monitor pagelet (IT_PE_SWDG_SUM) to review the installed software licenses versus serial ID-based authorized software licenses.
An alert displays when installed software licenses exceed the number authorized.
Navigation:
Click the Personalize Content link on the PeopleSoft Home page.
Select Software Device Monitor.
This example illustrates the fields and controls on the Software Device Monitor pagelet. You can find definitions for the fields and controls later on this page.

Field or Control |
Description |
|---|---|
Software Title |
Displays the software licenses that are configured for tracking by Software Device Group ID. The Software Device Group is a grouping of machines that is used to associate a Content Manager (EMPLID) to a group of machines by their Serial ID. Group definitions can contain groups as well as machines. |
Alert |
Displays a warning icon if the number of installed licenses exceeds the number of authorized licenses. Alerts are not displayed for device groups that are defined as count licenses on the Define Software Titles/Users page. |
Installed |
Displays the count of licenses that are installed based on Serial ID according to the Asset Repository. |
Authorized |
Displays the count of authorized licenses associated with a serial ID. Count license device groups are not included in the count. |
Declared |
Displays the count of licenses that are declared for the Software Device Group based on Serial ID. Click the link to access the Software Device Inventory page. The search option for the software title and Group ID will be supplied. |
Unresolved |
Displays the number of licenses associated with devices that do not belong to any Software Device Group, or licenses for devices that are not in the Asset Repository. For those devices in the Asset Repository but not in any Software Device Group, the licenses are counted and the number of CPUs are as defined in the Asset Repository. Machines that are not in the Asset Repository are counted as one per device. Click the link to access the Resolve Device Licenses page. Search by Software Title or by Serial Number. |
Use the Software Inventory Monitor pagelet (IT_SFTWR_INV) to review the counts of total licenses versus installed licenses, the counts for authorized and unauthorized users.
Navigation:
Click the Personalize Content link on the PeopleSoft Home page.
Select Software Inventory Monitor.
This example illustrates the fields and controls on the Software Inventory Monitor pagelet. You can find definitions for the fields and controls later on this page.

Field or Control |
Description |
|---|---|
Software Title |
Displays the software licenses that are configured for tracking. |
Inventory |
Displays the count of purchased software licenses. This column includes both employee and device authorizations. Click the link to access the Software License Inventory page. |
Installed |
Displays the count of users that installed the specific software This column includes both employee and device authorizations. Click the link to access the Discover Software Inventory page. The search option for the software title will be supplied. |
Employee Authorized |
Displays the count of authorized users who installed the software. This column excludes device authorizations. Click the link to access the Discover Software Inventory page. The search option for the software title will be supplied as well as the value of Employee Authorized in the Authorized Search option. |
Employee Unauthorized |
Displays the count of unauthorized users who installed the software. This column excludes device authorizations. Click the link to access the Discover Software Inventory page. The search option for the software title will be supplied as well as the value of Employee Unauthorized in the Authorized Search option. |
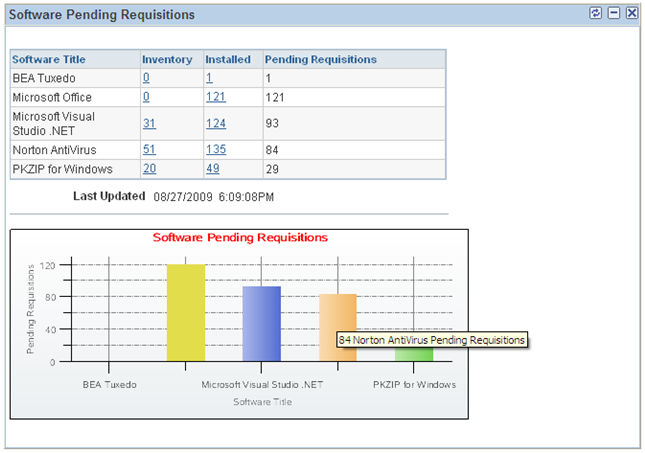
Use the Software Pending Requisitions pagelet (IT_SFTWR_PEND) to review a list and graphic representation of software licenses that the company must acquire to keep the enterprise in compliance.
Navigation:
Click the Personalize Content link on the PeopleSoft Home page.
Select Software Pending Requisitions.
This example illustrates the fields and controls on the Software Pending Requisitions pagelet. You can find definitions for the fields and controls later on this page.
Field or Control |
Description |
|---|---|
Software Title |
Shows only those software titles that are defined with track requisitions On and when the installed copies exceed the purchased copies. |
Inventory |
Displays the number of purchased copies of the software title. Click the link to access the Software License Inventory page. |
Installed |
Displays the number of installed copies of the software title. This column includes both employee and device authorizations. Click the link to access the Discover Software Inventory page. |
Pending Requisitions |
Displays the difference between the number of purchased copies and the number of installed copies. |
Software Pending Requisitions (bar chart) |
This pagelet includes a corresponding bar chart at the bottom. Mouse over the Software Pending Requisitions bar chart and view the number of pending requisitions with respective software titles. |
Use the Software Progress Report pagelet (IT_PRGS_SWC) to review the up-to-date results of IT asset change or upgrade initiatives.
Navigation:
Click the Personalize Content link on the PeopleSoft Home page.
Select Software Progress Report.
This example illustrates the fields and controls on the Software Progress Report pagelet. You can find definitions for the fields and controls later on this page.

Field or Control |
Description |
|---|---|
Report |
Defines which template (a container for report parameters) drives this line of data. |
Area |
Displays the associated business unit. |
Target |
Displays the total number of expected actions at the outset of a project such as the count of machines that meet the criteria. This number is generated when the report is run for the first time. |
To Do |
Displays the number of outstanding actions in a project. Click to view a list of items for a specific project. On the Progress Report Detail page, you can drill down to the details for each item in the project. |
% Complete |
Displays the percentage of completion for a project. |
Use the Software Renewal pagelet (IT_SFTWR_RENEW) to review the alerts to the IT Asset Manager when a contract needs to be renewed or renegotiated.
Navigation:
Click the Personalize Content link on the PeopleSoft Home page.
Select Software Renewal.
This example illustrates the fields and controls on the Software Renewal pagelet. You can find definitions for the fields and controls later on this page.
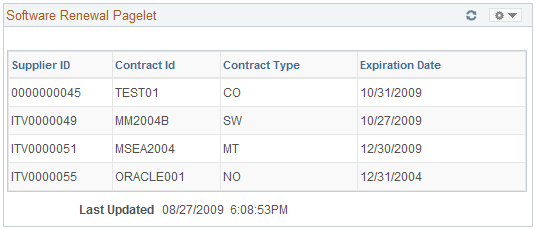
Software assets with contracts that have an expiration date, with a status of Active and with a Renewal Notice value (that is, the renewal notice is not blank), will be included in the Software Renewal metric if the system date or As of Date of the process is greater than the expiration date minus the number of days entered in the Renewal Notice.
Field or Control |
Description |
|---|---|
Supplier ID |
Displays values from the supplier table. |
Contract Id |
Displays the contract number determined during negotiations with supplier. |
Contract Type |
Displays the user-defined contract type. |
Expiration Date |
Displays the end date of the contract. |