Using the PeopleSoft Fluid User Interface for Project Management
Oracle’s PeopleSoft has two user interfaces:
PeopleSoft Classic User Interface, which was designed to be used on a laptop and desktop.
This interface was previously known as PIA (PeopleSoft Internet Architecture).
PeopleSoft Fluid User Interface, which was designed to be used on mobile devices, but can also be used on a laptop and desktop.
The PeopleSoft application reads the type of device you are using and renders the page accordingly. However, some pages are not designed for smart phones at this time.
PeopleTools documentation regarding the PeopleSoft Fluid User Interface includes:
PeopleTools: Fluid User Interface Developer’s Guide.
PeopleTools: Applications User's Guide, Working With PeopleSoft Fluid User Interface.
|
Page Name |
Definition Name |
Usage |
|---|---|---|
|
PC_SUM_PR |
Use this page to run the process that summarizes project resources. |
|
|
RUN_PC_MY_PRJ |
Use this page to automatically update the My Projects page for all Project Costing users based on the Default Auto Population Options at the installation level or the My Projects Options at the user preferences level. Important! This process must be run on a regular basis to keep all tiles and pages current for Project Management fluid pages. |
|
|
(none) |
Use this page view project statistics and access additional pages. |
A banner appears at the top of every PeopleSoft Fluid page, includes the page label, and these standard buttons
Field or Control |
Description |
|---|---|
|
Select the Actions List button to see a list of available actions for the current window. Access pages to personalize window content or sign out. |
|
Select the Home button to return to the main PeopleSoft Home page. |
|
Select the NavBar button to expand the NavBar window, where you can select window content from options, such as Recent Places, My Favorites, Navigator, My Preferences, and Fluid Home. Select again to collapse the NavBar window. |
|
Select the Notifications button to view actions and alerts in a notifications window. |
|
Select Personalize NavBar to access the personalization window, where you can add and remove selected tiles from the NavBar. |
|
Select Related Actions to view available related actions. |
|
Select to expand a pane. The pane may contain tabs that you can select to view detailed information. |
|
Select Show Filters to open a pane that displays filters. Filters can be used to reduce the number of records in the results section. |
 (Actions List button)
 (Home button)
 (NavBar button)
 (Notifications button)
 (Personalize NavBar icon)
 (Related Actions icon)
 (Expand Pane)
 (Show Filters icon)
Field or Control |
Description |
|---|---|
|
Click the Options Menu icon to open additional options for the page. Specific options are described for each page below. |
|
Select an option to view the data as a vertical bar chart, line chart, pie chart, or horizontal bar chart. |
|
Select an option to view the results as a grid or a list. |
|
Select the Related Actions icon to view and perform additional transactions. Specific actions are described for each page below. |
|
Click the Show Filters icon to open a right side panel that allows you to select specific facets on which to search. Facet values depend on the type of search. |
 (options menu icon)
 (chart options icons)
 (view result options icons)
 (related actions icon)
 (show filters icon)
Use the Project Management home page to view project statistics and access additional pages.
Navigation:
This example illustrates the tiles on the Project Management home page.
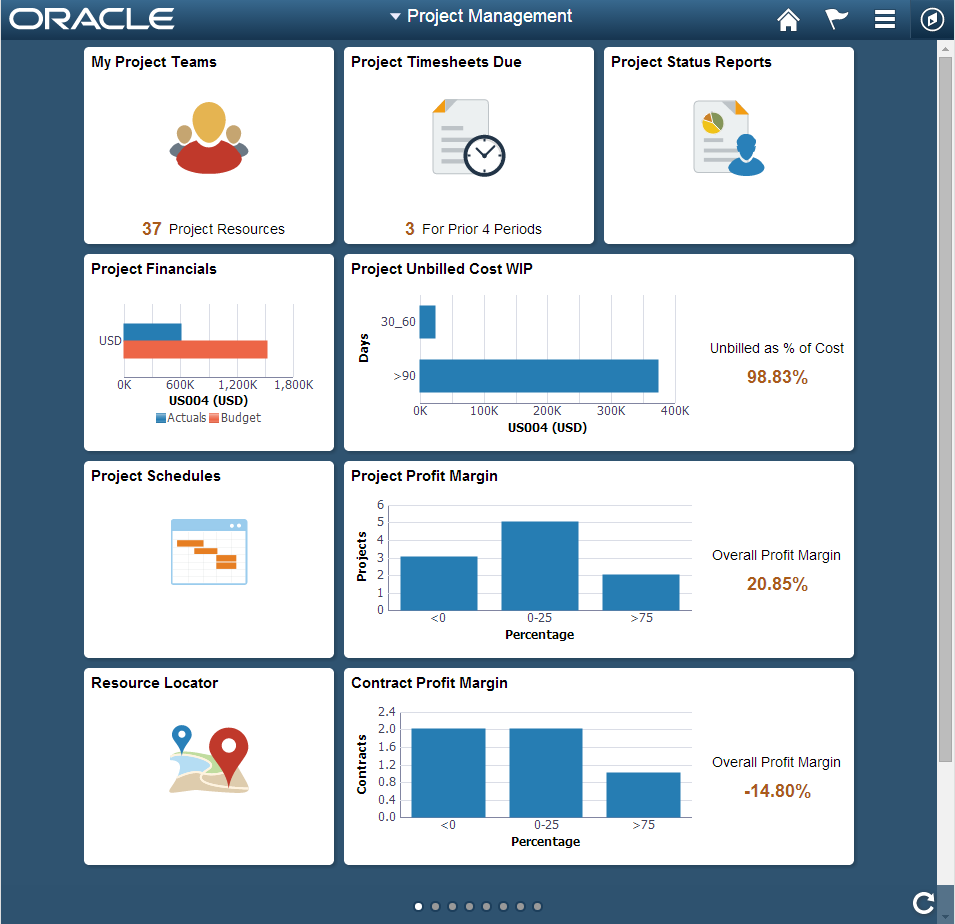
Use this page to view high-level information that is shown on each tile. You can also access PeopleSoft Fluid pages by clicking or tapping each tile.
Note: The projects that are available on your Projects List Page determines which projects and values are displayed.
Field or Control |
Description |
|---|---|
My Project Teams |
Displays the number of unique resources that are assigned to the projects that appear on your Projects List page. Click this tile to access the My Project Teams (pivot) Page. |
Project Timesheets Due |
Displays the number of timesheets that are due from resources on your projects list, based on the number of periods specified on the My Preferences - Project Timesheets Due Page. Click this tile to access the Project Timesheets Due (pivot) Page. |
Project Status Reports |
Displays status reports for the resources on your projects list. Click this tile to access the Project Status Reports Page (pivot). |
Project Financials |
Displays a horizontal bar chart of the actual versus the budget amount for all projects that appear on your Projects List page and are limited to the business unit and currency specified on the My Preferences - Report Business Unit Page. Click this tile to access the Project Financials (pivot) Page. |
Project Unbilled Cost WIP (project unbilled cost work in progress) |
Displays the cost of projects that have not been billed based on the values specified on the Reporting Options - Reporting Groups Page. The system calculates this percentage based on actual costs that do not have a status of W (worksheet) or D (distributed) to Billing. Click this tile to access the Project Unbilled Cost WIP (pivot) Page. |
Project Schedules |
Click this tile to access the Project Schedules Page. |
Project Profit Margin |
Displays project profit margin groupings based on the values specified on the Reporting Options - Reporting Groups Page. Click this tile to access the Project Profit Margin (pivot) Page. |
Resource Locator |
Click this tile to access the Resource Locator Page. |
Contract Profit Margin |
Displays contract profit margin groupings based on the values specified on the Reporting Options - Reporting Groups Page. Click this tile to access the Contract Profit Margin (pivot) Page. |
Proj Data Compression |
Click this tile to access the Reviewing Project Data Compression Using PeopleSoft Fluid page. |
Simplified Analytics in the Project Costing enable project managers to compare metrics among the projects. With Simplified Analytics, users can create, customize and save analytic reports, and drill down to detailed information.
Simplified Analytics enables:
End users of a fluid application page to create contextual analytic reports. They can create their own reports based on the pre-defined templates by selecting the fields, filling the prompt fields, defining the layout, and selecting different types of visualizations.
Administrator or super user to create and publish reports (based on the configured base templates) to all users of the component.
End users to add a saved analytic report to the home page and view later.
Note: To enable Simplified Analytics for a component, application developers or business administrators have to associate one or more Pivot Grid models (or base templates) to a component. They can also map page fields to the prompts that are associated with the template model to define the required context.
The Simplified Analytics feature is only available for fluid components in PeopleTools 8.55. This feature must be enabled for fluid components before users can use the Simplified Analytics Wizard to create and view analytic reports.
|
Simplified Analytic Name |
Pivot Grid Model Name |
Usage |
|---|---|---|
|
Budget Vs Actual |
PC_BUD_VS_ACT_CRRNT_PERIOD_SA |
Allows the user to view the Cost Budget, Actual Budget, Cost Variance, Revenue Budget, and Revenue for a given Budget Period. |
|
Budgets Not Finalized |
PC_MY_UNPOST_BD_SA |
Allows the user to view project budget information for budget plans that have not been finalized to Commitment Control (if the budget is for a Commitment Control ledger group), or Projects (if it is a Project Costing-only budget). |
|
Closed Projects with Assets |
PC_CLOSE_PRJ_ASSET_PVG_SA |
Allows the user to view projects that have a processing status of Closed and have an asset associated with the project that is in an Open status. |
|
Financial Summary |
PC_FIN_SUM_LIFE_TO_DATE_SA |
Allows the user to view the Cost Budget, Actual Budget, Cost Variance, Revenue Budget, and Revenue for the entire life of a project. |
|
Project Unbilled Cost WIP |
PC_UNBILLED_COST_WIP_FL_SA |
Allows the user to view project costs that have not been billed or are work in progress for your projects. |
Enabling/Disabling Simplified Analytics in Project Analytics
For Simplified Analytics, pivot grids must be assigned to a component. A pivot grid attached to a component forms the base of a Simplified Analytic.
Note: Simplified Analytics is not available in small form factor (SFF).
Use the Assign Related Content (PTCS_SERVICECFG) page to enable/disable Simplified Analytics in the Project Analytics.
Navigation:
Search for Project Analytics and then click Edit. Verify if the Enable check box is selected for the Simplified Analytics.
Select/Deselect the Enable check box to enable/disable Simplified Analytics.
When Simplified Analytics is assigned to a component and enabled, the My Analytics panel is displayed on the right side of the component.
This example illustrates the fields and controls on the Project Analytics Page. You can find definitions for the fields and controls later on this page.
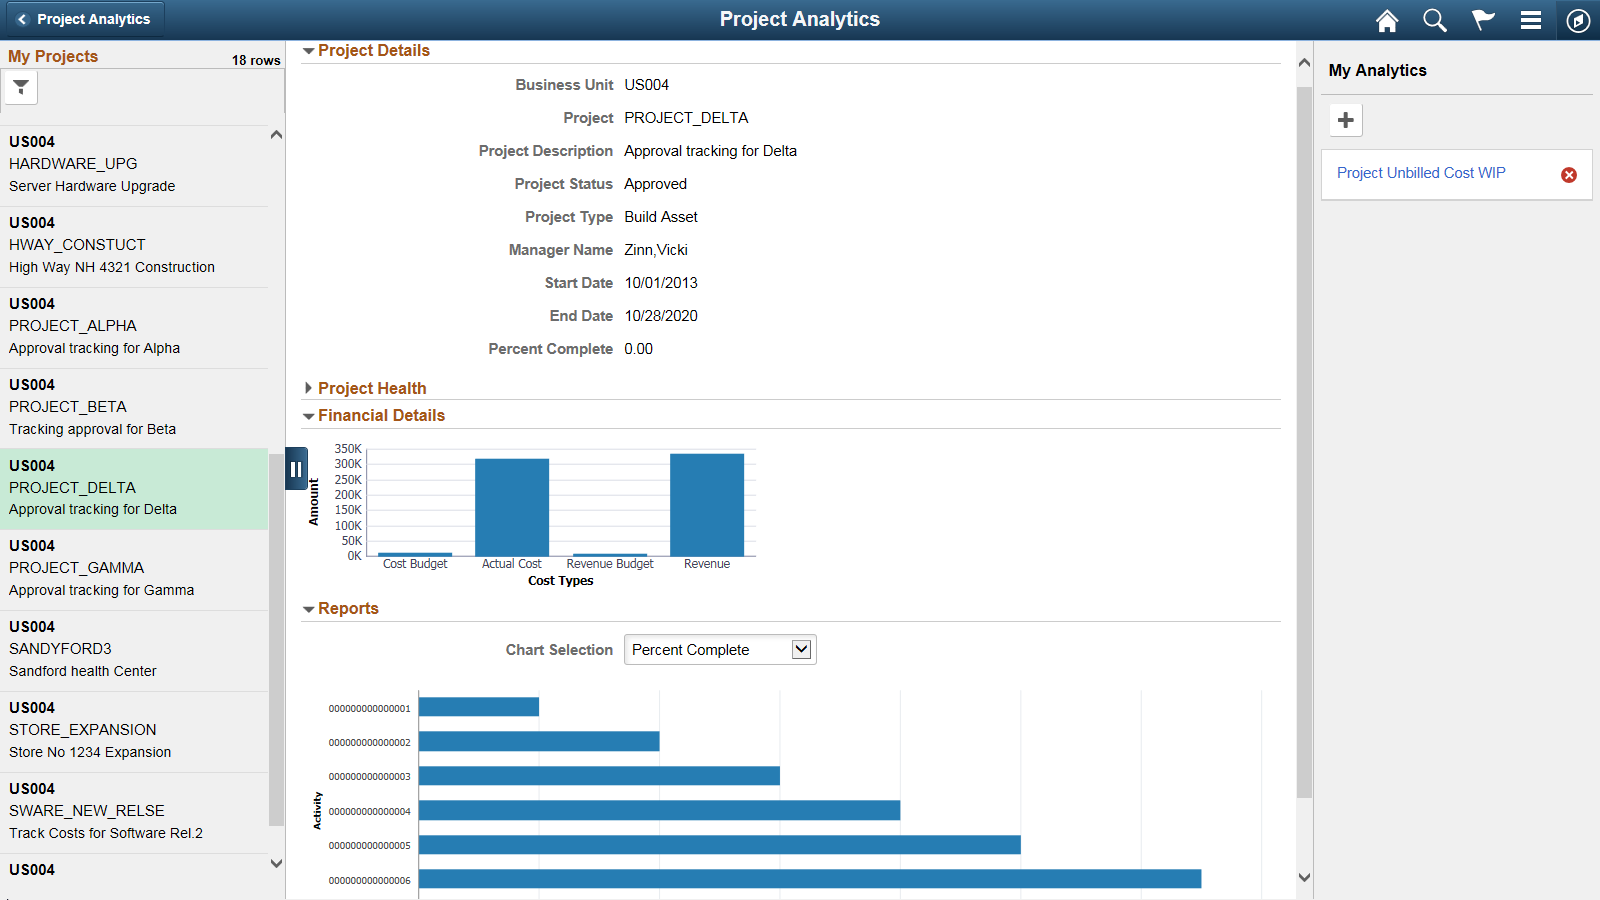
Use the My Analytics panel to create, edit, or view the analytic reports in the Project Analytics.
Create Analytics Wizard - Step 1
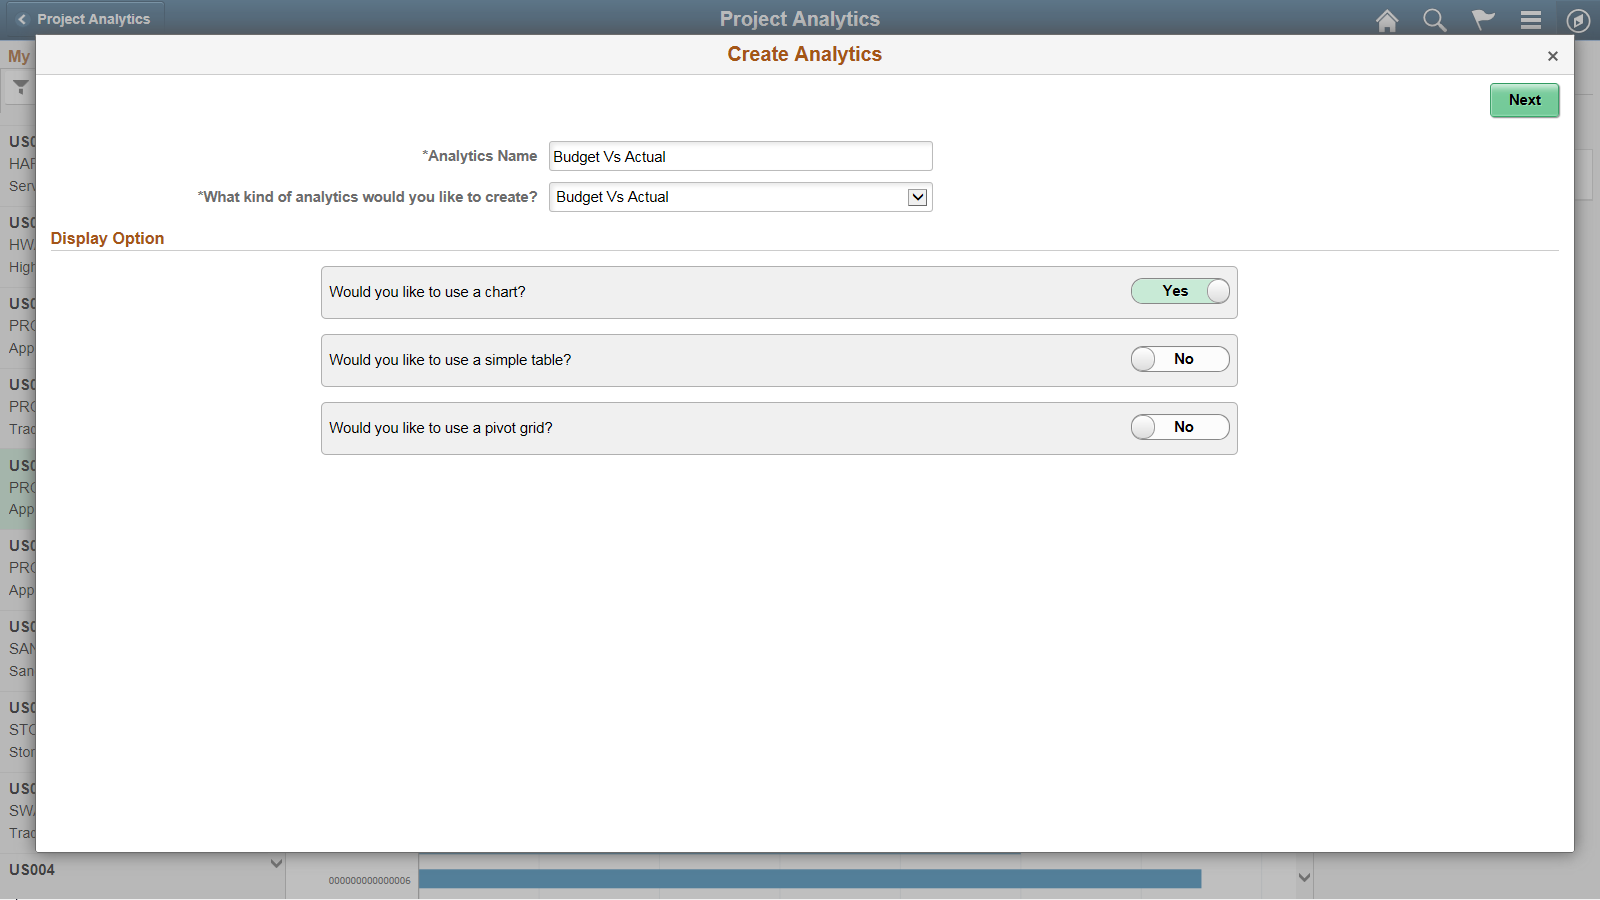
Use the Create Analytics Wizard - step 1 to specify the names of the analytic reports, select the analytic report template and select the display options that will be used to create the analytic report.
This example illustrates how to create an analytic report for Budget Vs. Actual. You can follow these steps to create other analytic reports.
Navigation:
Select the + button to create a new Analytic.
This example illustrates the fields and controls on the Create Analytics Wizard - Step 1 (Budget Vs. Actual). You can find definitions for the fields and controls later on this page.
Term |
Definition |
|---|---|
Analytics Name |
Enter a name for the analytic report. |
What kind of analytics would you like to create? |
Displays the available analytic templates that are used to create the analytic report. The template you select from this list determines the fields and prompts in the next step of the wizard, Create Analytics - step 2. Note: This drop-down list is not available when only one template is available. |
Display Option |
Define the display options for the analytic reports. The following display options are available; you can use different combinations of these display options:
|
Next |
Click to advance the wizard to the next page. |
Create Analytics Wizard - Step 2
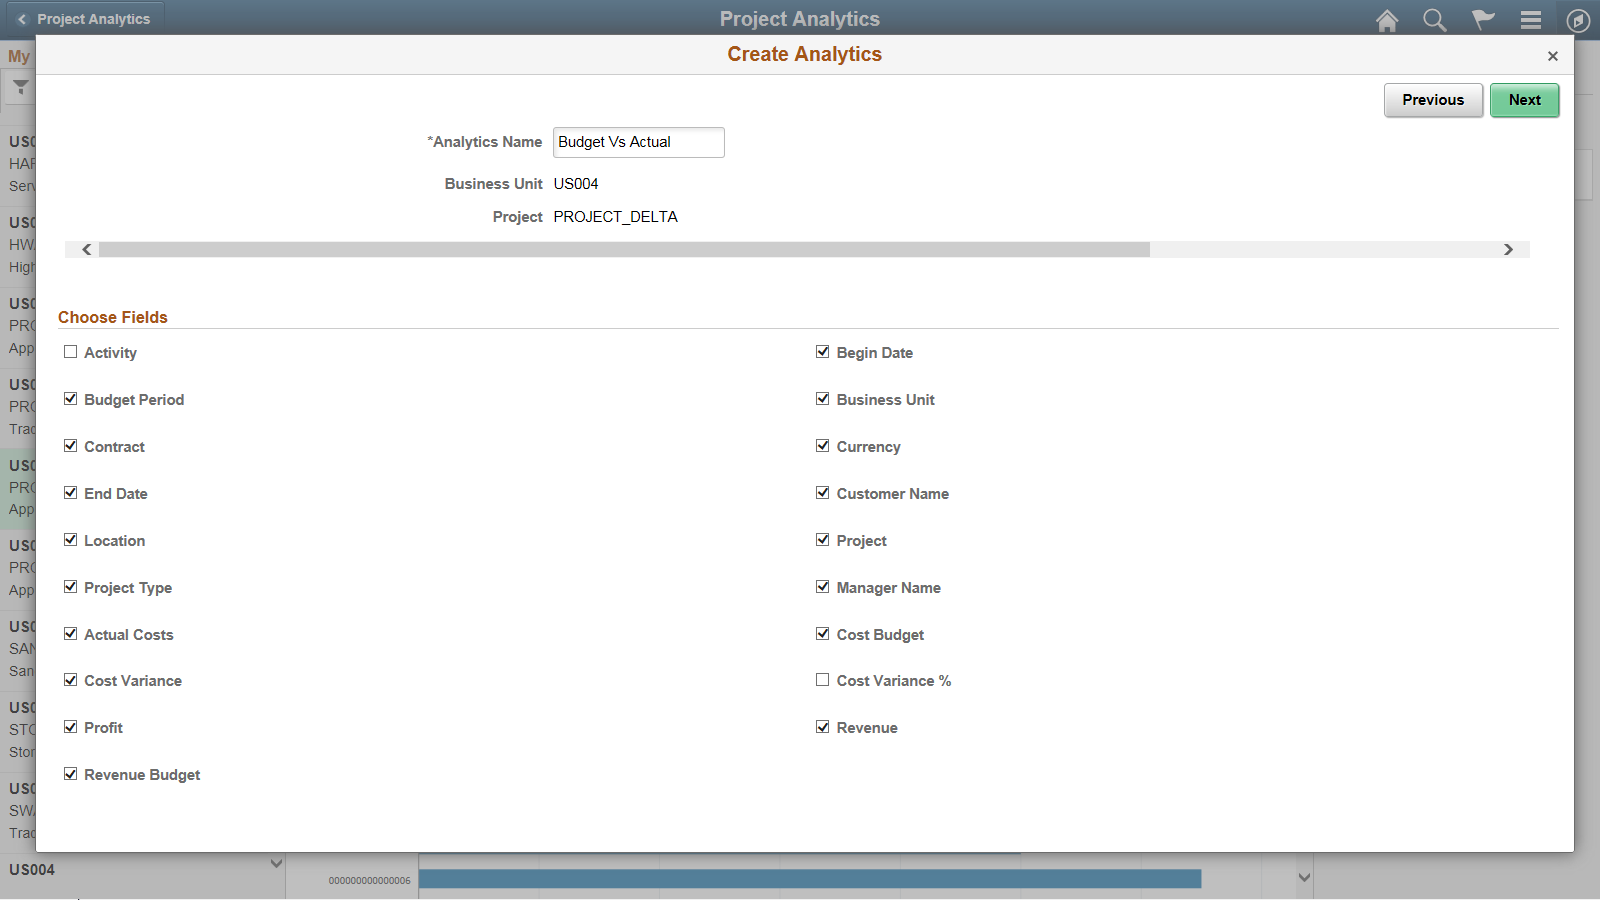
Use the Create Analytics Wizard - step 2 to select the fields for the analytic reports and to change the default values of the prompt fields.
Navigation:
From the Create Analytics Wizard - step 1, click the Next button.
This example illustrates the fields and controls on the Create Analytics Wizard - Step 2 (Budget Vs. Actual). You can find definitions for the fields and controls later on this page.
Term |
Definition |
|---|---|
Choose Fields |
Use this section to select the fields that will appear in the analytic reports. Some fields are preselected because those fields form a part of rows/columns/axis/filters in the base template model. |
Previous |
Click to go back to the Create Analytics Wizard - step 1. |
Next |
Click to advance the wizard to the next page, where you can preview the display of the analytic reports. |
Create Analytics Wizard - Step 3
Use the Create Analytics Wizard - step 3 to preview the analytic reports based on the display options, fields, and prompts selected in the previous steps of the wizard. Optionally, you can modify (by dragging and dropping, applying filters, and so on) the analytic reports to finalize the design and then click the Save button to save the final report.
Navigation:
From the Create Analytics Wizard - step 2, click the Next button.
This example illustrates the fields and controls on the Create Analytics Wizard - Step 3 (Budget Vs. Actual). You can find definitions for the fields and controls later on this page.
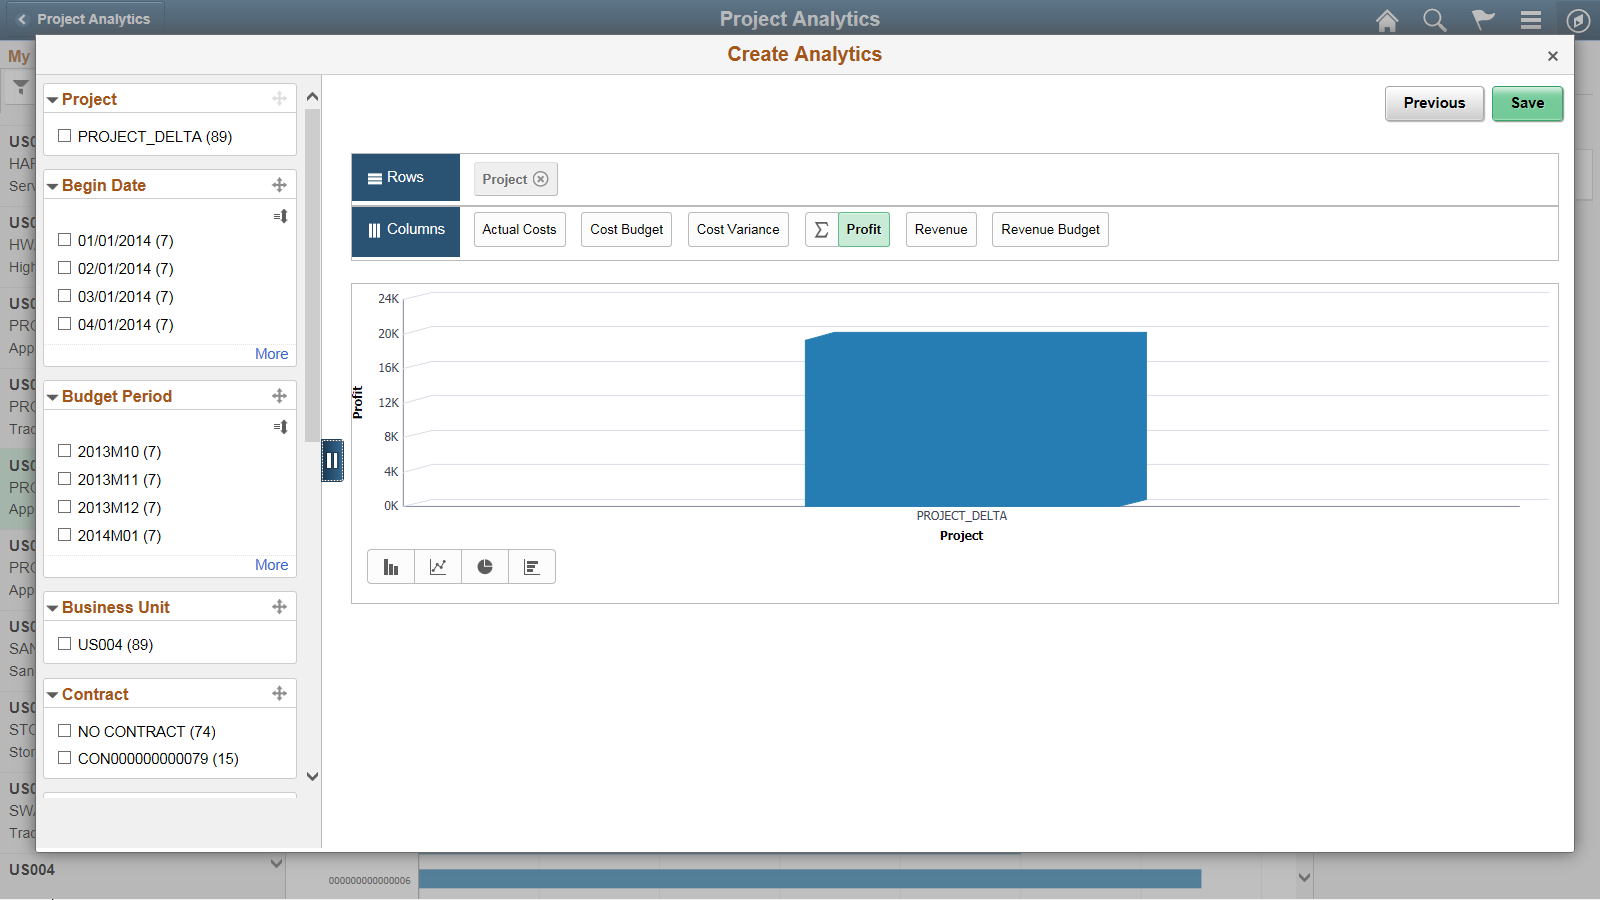
From the preview window, use the Save button to save the analytic report.
On saving the analytic report, the Add to Homepage button is enabled which you can use to add the analytic report to the fluid homepage. For more information, see Adding Analytic Reports to the Fluid Homepage section in PeopleTools: Pivot Grid
If you are an administrator or super user, saving the analytic report enables the Publish Options button which you can use to publish the analytic reports to the My Analytics section or the Tile repository of all users of the component. For more information, see Publishing the Analytic Report section in PeopleTools: Pivot Grid
Note: The buttons Add to Homepage and Publish Options are displayed only when you view the analytic report on a tablet, Laptop or a large monitor. These buttons are not displayed on a smartphone.
Follow the same steps to create analytic reports for Budgets Not Finalized, Closed Projects with Assets, Financial Summary and Project Unbilled Cost WIP Analytics.
For additional information on Simplified Analytics, see PeopleTools: Pivot Grid