Reviewing Programs and Projects
|
Page Name |
Definition Name |
Usage |
|---|---|---|
|
PGM_REVIEW_PROG |
Displays detailed information about projects and programs on the enterprise program tree and enables drilling down to each program and project. |
|
|
RUN_PGM1000 |
Specify run control parameters to create report the Review Program report (PGM1000). |
|
|
PGM_VIEW_EPT |
View a display-only version of the enterprise program tree for reference purposes. |
|
|
PC_MGR_WORKBENCH |
View a project summary and health data. |
|
|
PGM_MGRWBENCH_ACT |
View activity summary and health data. |
The Manager Workbench is organized into two pages. Managers can view information about a project on the Manager Workbench page and click the Activity tab to view workbench information about the project's activities. The project Manager Workbench page contains information about the project manager, project status and project processing status. Additionally, the Manager Workbench displays health indicators for overall project and activity health and for each scorecard component. You can define an option at the business unit-level to manually enter or automatically calculate project health indicators for project overall, schedule, budget, resources, issues, and risks. You can override this option at the project level. The system displays these colored indicators based on the project or activity health:
Term |
Definition |
|---|---|
|
Indicates good health for the project or activity health attributes. |
|
Indicates fair health for the project or activity health attributes. |
|
Indicates poor health for the project or activity health attributes. |


The Manager Workbench also contains these collapsible group boxes:
Scorecard: Information about the schedule, budget, resources, issues, and risks.
Milestones: List of the project milestone activities
Top 5 Issues: List of the top five unresolved issues.
Top 5 Risks: List of the top five risks based on risk status and priority.
Project Exceptions: Information on late activities, unassigned activities, upcoming activities, overloaded resources, activity and assignment conflicts, and late deliverables.
You can expand and collapse the group boxes, all at once or individually, to review detailed information about the health of the project.
On the activity tab of the Manager Workbench, you can select the project activity that you want to review. The workbench contains information about the activity owner, activity status, and activity processing status. It includes activity health indicators that the system calculates each time that you access the page by using the most recent data on the activity schedule, budget, resources, issues, risks, and deliverables. It also lists the top five issues and risks for the activity.
From both of the Manager Workbench pages you can navigate to other components in PeopleSoft Program Management and PeopleSoft Project Costing to view or modify information about the project or activity.
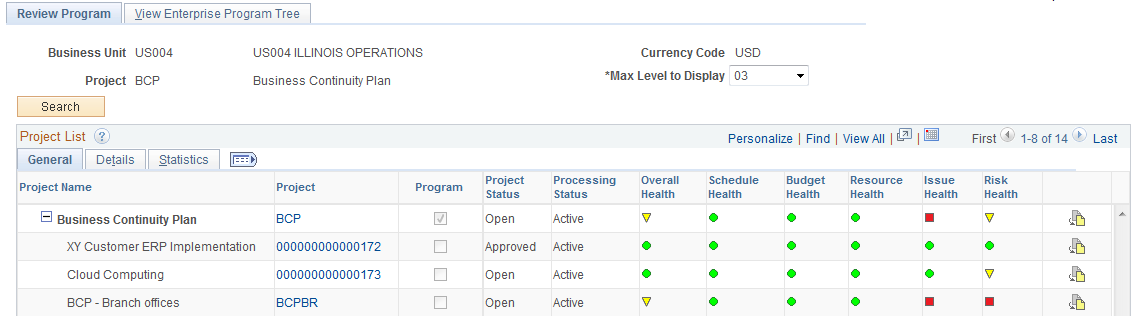
Use the Review Program page (PGM_REVIEW_PROG) to displays detailed information about projects and programs on the enterprise program tree and enables drilling down to each program and project.
Navigation:
This example illustrates the fields and controls on the Review Program page. You can find definitions for the fields and controls later on this page.
Field or Control |
Description |
|---|---|
Max Level to Display |
Indicate the maximum number of program levels to display for review. Options are 01, 02, or 03 levels down from the selected program. |
Search |
Click to display a list of programs and projects. The size of the list depends on the number of levels that you specify in the Max Level to Display field. |
Project List - General
Field or Control |
Description |
|---|---|
Project Name |
Displays all of the programs and projects that are part of this program in a hierarchical format. |
Project |
Display the project ID of the program or project as a link. Click a project ID to access the project General Information page of the Project General (PROJECT_GENERAL) component, where you can view or update details of the program or project. |
Program |
Indicates whether the project is a program. If the check box is selected, the project is a program. If the check box is deselected, the project is not a program. |
Project Status |
Displays the current project status. |
Processing Status |
Displays the current processing status. |
Overall Health, Schedule Health, Budget Health, Resource Health, Issue Health, and Risk Health |
Displays a visual indicator to determine the health rating for the project. You can hover your mouse over the icon to display the date that the health was last updated. |
|
Click the Link to Project Request icon to access the Project Request component. This option is valid only if the project or program is linked to a project request. Note: If you click the Link to Project Request icon for a project that was not directly generated from a project request, the system checks whether the project has a parent program with an associated project request. If a project request is found for the parent program, the system transfers you to that project request. |

Project List - Details
This view displays fields that pertain to various elements of the program or project—percent complete, start and end dates, category, application, application area and actual and budget cost data.
Field or Control |
Description |
|---|---|
Percent Complete |
Lists the project percent complete. |
Start Date and End Date |
Lists the start and end dates for the program or project. |
Category |
Lists the category for the program or project. |
Application Area |
Lists the application area for the program or project. |
Application |
Lists the application for the program or project. |
Planned Cost Budget |
Lists the cost budget for projects in pending processing status. The system selects the budget data from the Budget Summary table (PC_BUD_SUMMARY). The budget data that appears is data that is not yet finalized. This column is not summarized at the program level. Click an amount to access the Budget Detail page, where you can review the details for the budget amount. |
Cost Budget |
Lists the finalized cost budget for projects with active or inactive processing status. The system select the budget data from the Activity Summary table (PC_ACTIVITY_SUM). This column is summarized at the program level. Click an amount to access the Budget Detail page, where you can review the details for the budget amount. |
Cost Actuals |
Lists the project's actual cost. This data is selected from the PC_ACTIVITY_SUM table. This column is summarized at the program level. |
Cost Variance |
Displays the difference between the cost budget and cost actuals, which is calculated as (Budget Cost) – (Actual Cost). |
Project List - Statistics
Field or Control |
Description |
|---|---|
Total Issues |
Lists how many unresolved issues there are for the project. (Unresolved issues are issues where the resolution date is blank.) Click the amount to access the Issues search dialog page, where you can review project issues. |
Critical Issues |
Lists how many critical unresolved issues exist for the project. |
Percent Critical |
Lists the percentage of project issues that are critical. |
Total Deliverables |
Lists the total number of deliverables there are for the project. |
Overdue Deliverables |
Lists the number of project deliverables that are late. |
Percent Overdue |
Lists the percentage of deliverables that are late. |
Total Risks |
Lists the total number of risks that exist for the project. |
No Action Plan Risk |
Lists the number of project risks with no action plan. |
Percent No Action |
Lists the percentage of risks that have no action plan. |
Project Manager |
Displays the current program or project manager. |
Go To
Field or Control |
Description |
|---|---|
Run Review Program Report |
Click to transfer to the Review Program Report page, where you can enter parameters to run the Review Program Details Application Engine process (PGM_REVW_AE). |
Program Budget Analysis |
Click to transfer to the Program Budget Analysis page, where you can view the program budget compared with the rolled-up project budgets. Note: You must enable the PeopleSoft Analytic Calculation Engine to view the Program Budget Analysis page. See PeopleTools: Analytic Calculation Engine, “Managing Analytic Servers”, Configuring and Starting Analytic Servers. |
Use the Review Program Report page (RUN_PGM1000) to specify run control parameters to create report the Review Program report (PGM1000).
Navigation:
. Click the Run Review Program Report link on the Review Program page.
Specify the report parameters and click Run to generate the report.
This report assists you in processing inquires that result in more than 50 programs or projects that meet the search criteria on the Review Program page. Because of the amount of processing time that could be required to return calculated information for more than 50 programs or projects, PeopleSoft Program Management delivers the Review Program Report. This report provides the same information as the Review Program page; however, it does so by using the PeopleSoft Process Scheduler to launch the Review Program Details Application Engine process (PGM_REVW_AE) and the Review Program report (PGM1000).
Use the View Enterprise Program Tree page (PGM_VIEW_EPT) to view a display-only version of the enterprise program tree for reference purposes.
Navigation:
This example illustrates the fields and controls on the View Enterprise Program Tree page. You can find definitions for the fields and controls later on this page.
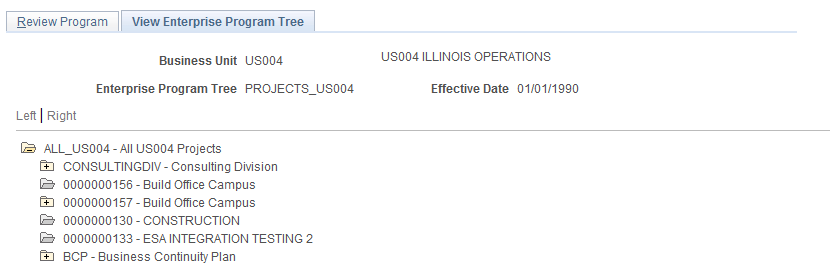
This page is a display-only view of the enterprise program tree that is for the selected program.
Field or Control |
Description |
|---|---|
|
Click to expand a folder and view its subordinate programs or projects. |
|
Click to collapse a folder and all of its subordinate programs or projects. |
Tree Manager |
Click to access the Tree Manager page on which you can edit the tree. |


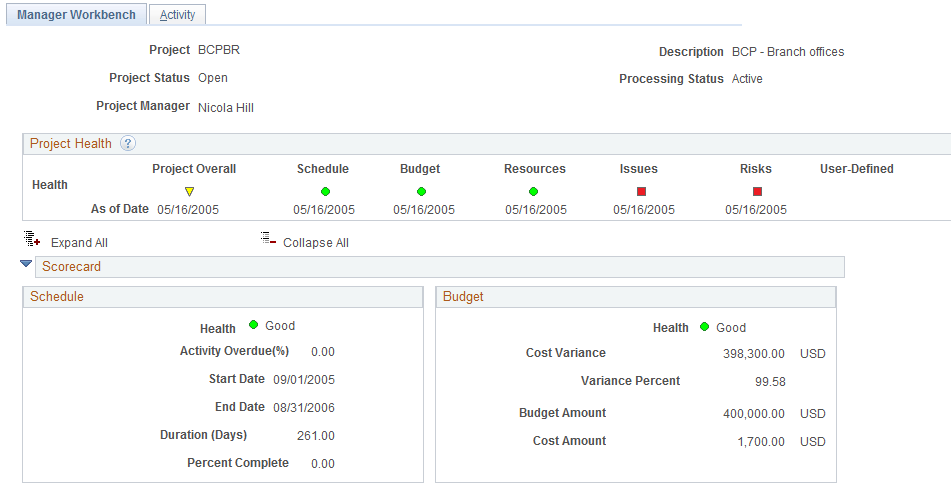
Use the Manager Workbench page (PC_MGR_WORKBENCH) to view a project summary and health data.
Navigation:
This example illustrates the fields and controls on the Manager Workbench page (1 of 5). You can find definitions for the fields and controls later on this page.
This example illustrates the fields and controls on the Manager Workbench page (2 of 5). You can find definitions for the fields and controls later on this page.
This example illustrates the fields and controls on the Manager Workbench page (3 of 5). You can find definitions for the fields and controls later on this page.
This example illustrates the fields and controls on the Manager Workbench page (4 of 5). You can find definitions for the fields and controls later on this page.
This example illustrates the fields and controls on the Manager Workbench page (5 of 5). You can find definitions for the fields and controls later on this page.
This page provides a summary of project data from various components in PeopleSoft Program Management and PeopleSoft Project Costing. The Manager Workbench provides project managers with an overview of their projects and enables them to navigate quickly to view details in either application.
Project Health
Field or Control |
Description |
|---|---|
Project Overall |
Displays the visual indicator to identify the overall project health that is either manually entered on the project definition or calculated by the system as the weighted average of the health indicators of scorecard components. |
Schedule, Budget, Resources, Issues, and Risks |
Displays the visual indicator to identify the project attribute health that is either manually entered on the project definition or calculated by the system based on the health criteria that is established on the Program Management Options page. If no health criteria are established for the business unit in which this project resides, the health fields do not appear. |
User Defined |
Displays the visual indicator to determine good, fair, or poor health that you specify on the project definition. |
As of Date |
Displays the date that the project attribute health was last updated. |
|
Click to expand all of the sections on the page. |
|
Click to collapse all of the sections on the page. |


Scorecard - Schedule
This scorecard displays detailed information regarding project schedule health. The system calculates these values using the Program Refresh Application Engine process (PGM_PROGRFSH) and stores the data in the Project Health table (PC_PROJHEALTH).
Field or Control |
Description |
|---|---|
Activity Overdue(%) (Activity Overdue Percent) activities overdue |
Displays the percentage of overdue activities, which is calculated as ((Number of Overdue Activities) ÷ (Total Activities) × 100. |
Duration |
The project duration, in days. |
Percent Complete |
The percentage of the project that is complete. |
Scorecard - Budget
This scorecard displays detailed information regarding the budget for this project. The system calculates these values using the Program Refresh Application Engine process (PGM_PROGRFSH) and stores the data in the Project Health table (PC_PROJHEALTH). The system calculates budget health based on the budget alert criteria entered on the Budget Alerts page.
See Project Costing Options - Budget Alerts (business unit) Page.
Field or Control |
Description |
|---|---|
Cost Variance |
Displays the difference between the budget amount and cost amount, which is calculated as (Budget Cost) – (Actual Cost) . |
Variance Percent |
Displays the variance percentage for the project calculated, which is calculated as ((Budget Cost) − (Actual Cost)) ÷ (Budget Cost)) × 100. |
Budget Amount |
Displays the budget amount, which is calculated as the sum of all project transactions for the selected project, where the analysis type is in the project's budget analysis group (AN_GRP_ACTV_BUD). |
Cost Amount |
Displays the cost amount, which is calculated as the sum of all project transactions for the selected project, where the analysis type is in the project's cost analysis group (AN_GRP_TOT_COSTS). |
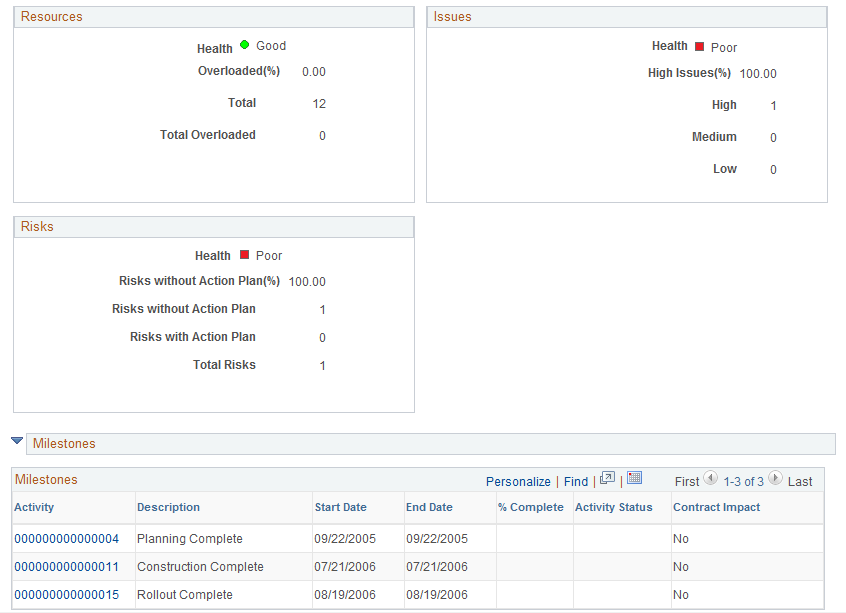
Scorecard - Resources
This scorecard displays detailed information regarding project resources. The system calculates these values using the Program Refresh Application Engine process (PGM_PROGRFSH) and stores the data in the Project Health table (PC_PROJHEALTH).
Field or Control |
Description |
|---|---|
Overloaded(%) (overloaded percentage) |
Displays the percentage of resources that have overbooked schedules, which is calculated as ((Number of Overloaded Resources) ÷ (Total Resources) × 100. |
Total |
Displays the number of resources that have been assigned to this project. |
Total Overloaded |
Displays the number of resources that are assigned to this project and are overbooked. |
Scorecard - Issues
This scorecard displays detailed information regarding project issues. The system calculates these values using the Program Refresh Application Engine process (PGM_PROGRFSH) and stores the data in the Project Health table (PC_PROJHEALTH).
Field or Control |
Description |
|---|---|
High Issues(%) (high issues percentage) |
Displays the percentage of issues that are high priority, which is calculated as ((Number of High Priority Issues) ÷ (Total Number of Issues) × 100. |
Scorecard - Risks
This scorecard displays detailed information regarding project risks. The system calculates these values using the Program Refresh Application Engine process (PGM_PROGRFSH) and stores the data in the Project Health table (PC_PROJHEALTH).
Field or Control |
Description |
|---|---|
Risks without Action Plan(%) (risks without action plan percentage) |
Displays the percent of risks that do not have an associated action plan, which is calculated as ((Number of Risks without an Action Plan) ÷ (Total Number of Risks) × 100. |
Milestones
Project milestones are key events in a project that have special significance. A milestone can be the completion of a major deliverable or the realization of an important approval. You define milestones in the Project Activity - Definition page. Use this section to view summary information for the activities that have been defined as milestones for this project.
Field or Control |
Description |
|---|---|
Activity |
Displays the activity ID of the milestone activity as a link to the activity definition. Click the activity ID link to transfer to the Project Activity component, where you can view and update the activity definition. |
Contract Impact |
Indicates whether this milestone is associated with any contract lines. Values include: Yes or No. When the project milestone is referenced in any PeopleSoft Contract billing plan, revenue plan, or contract milestone, Yes appears in this field. Click the Yes link to access the Impacted Contract Details page in PeopleSoft Contracts. |
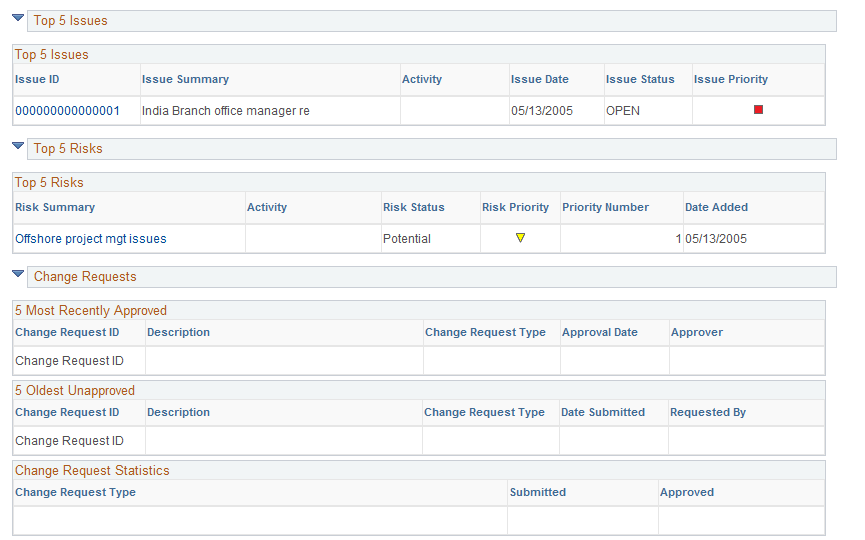
Top 5 Issues
Use this section to view the top five unresolved issues sorted by priority—highest to lowest, and age—oldest to newest.
Field or Control |
Description |
|---|---|
Issue ID |
Displays the issue ID as a link to the Issue page, where you can view or update issue data. |
Issue Priority |
Displays a color visual indicator to indicate the issue priority. |
|
Displays this symbol to indicate that this is a high priority issue. |
|
Displays this symbol to indicate that this is a medium priority issue. |
|
The system displays this symbol to indicate that this is a low priority issue. |


Top 5 Risks
Use this section to view the top five risks sorted first by risk status, risk priority—highest to lowest, then priority number—lowest to highest. This data is specified on the Project Risk page.
Field or Control |
Description |
|---|---|
Risk Summary |
Displays the risk summary as a link to the Project Risk page, where you can view or update risk information. |
Activity |
Displays the activity ID of the activity for which this risk is defined. The system displays the activity ID only if this is an activity risk. |
Risk Status |
Displays the status of the risk. The system only displays Active and Potential risks. |
Risk Priority |
Displays a color visual indicator to indicate the risk priority. |
|
Displays his symbol to indicate that this is a high priority risk. |
|
Displays this symbol to indicate that this is a medium priority risk. |
|
Displays this symbol to indicate that this is a low priority risk. |
Priority Number |
Displays the priority number that is defined on the Project Risk page. |


Change Requests - 5 Most Recently Approved
Use this section to view a list of the five most recently approved project change requests. Click the Change Request ID link to transfer to the Change Request page.
Change Requests - 5 Oldest Unapproved
Use this section to view a list of the five oldest unapproved project change requests. Click on the Change Request ID link to transfer to the Change Request page.
Change Requests - Change Request Statistics
Use this section to view the number of approved and submitted change requests that have been entered for this project. The change requests are sorted by change request type.
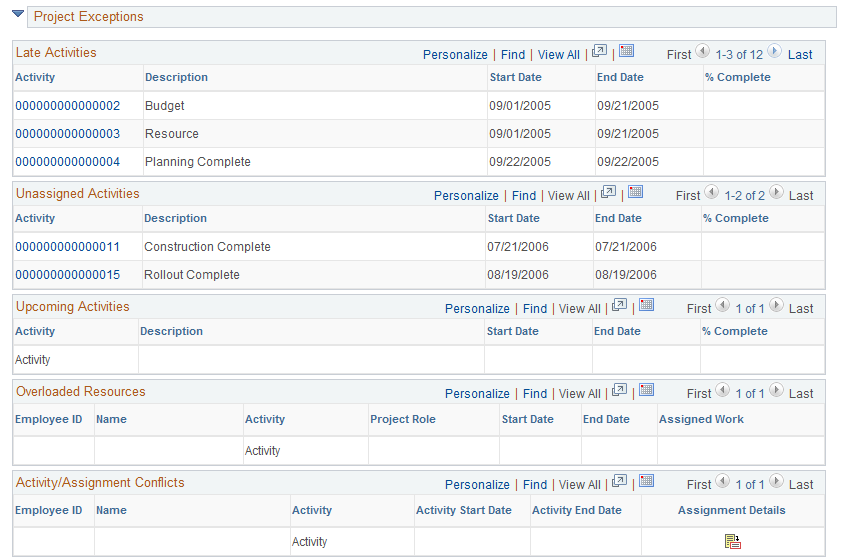
Project Exceptions - Late Activities
Use this section to view a list of detail activities that are incomplete after the activity end date. Click the Activity ID link to transfer to the Activity Definitions - General Information page, where you can view and modify the activity schedule.
Project Exceptions - Unassigned Activities
Use this section to view a list of detail activities for which there are no assigned resources. Click the Activity ID link to transfer to the Project - Resources page, where you can view and edit the activity definition.
Project Exceptions - Upcoming Activities
Use this section to view a list of detail activities that are scheduled to begin within the next week. Click the Activity ID link to transfer to the Activity Definitions - General Information page, where you can view and edit the activity definition.
Project Exceptions - Overloaded Resources
Use this section to view a list of overloaded resources, as determined by the Calculate Warning Indicator Application Engine (PGM_SCH_EDIT). Click the Activity ID link to transfer to the Resources by Activity page, where you can view and edit resources that are assigned to an activity.
Project Exceptions - Activity/Assignment Conflicts
Use this section to view a list of resources that have activity assignments beyond their assignment schedule in PeopleSoft Resource Management.
Click the Activity ID link to transfer to the Activity Definitions - General Information page, where you can view and edit the activity definition.
Click the Assignment Details icon to transfer to the Resource Detail page (PC_PRL_SCHED), where you can review the assignment details. This section appears only if PeopleSoft Resource Management is installed.
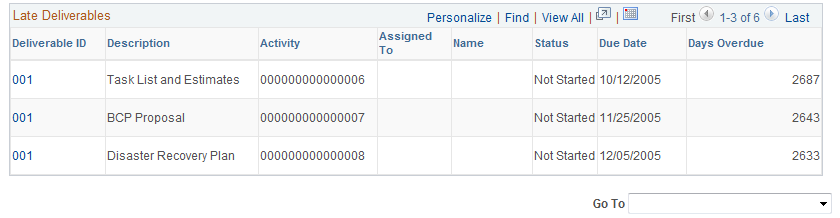
Project Exceptions - Late Deliverables
Use this section to view a list of incomplete deliverables that are past their due date. Click the Deliverable ID link to transfer to the Deliverable Detail page, where you can view and update deliverable data.
Go To
The Go To selections access other program management functions. Options are:
Field or Control |
Description |
|---|---|
Change Control Analysis |
Select to access the Change Control Analysis page to view a history of modifications for this project. |
Deliverables |
Select to access the Deliverables Summary component to view or update any of the project's activity's deliverables. |
Earned Value Projection |
Select to access the Earned Value Projection page where you can view earned value history and future projection for the project in an S-Curve chart. |
Issue Management |
Select to access the Issue Management component to add, view, and update project issues. |
Maintain Activity |
Select to access the Activity Definitions component to view or update any of the project's activities. |
Project Activities |
Select to access the Project Activities component to view a Gantt Chart of the project schedule. |
Project Budgeting |
Select to access the Budget Plan page, where you can view, update, and create a budget plan for the project. |
Project General |
Select to access the project General Information component (PROJECT_GENERAL) where you can view and update the elements of the project. |
Project Request |
Select to access the Project Request component to view the project request that is associated with this project. |
Project Transactions |
Select to access the Transaction List page for the project's activities. |
Project Valuation |
Select to access the Project Valuation page for the project. |
Status Reports |
Select to access the Review Status Reports page, where you can review project team members' status reports and mark them Complete. |
Use the Manager Workbench - Activity page (PGM_MGRWBENCH_ACT) to view activity summary and health data.
Navigation:
. Select the Activity tab.
This example illustrates the fields and controls on the Manager Workbench - Activity page (1 of 2). You can find definitions for the fields and controls later on this page.
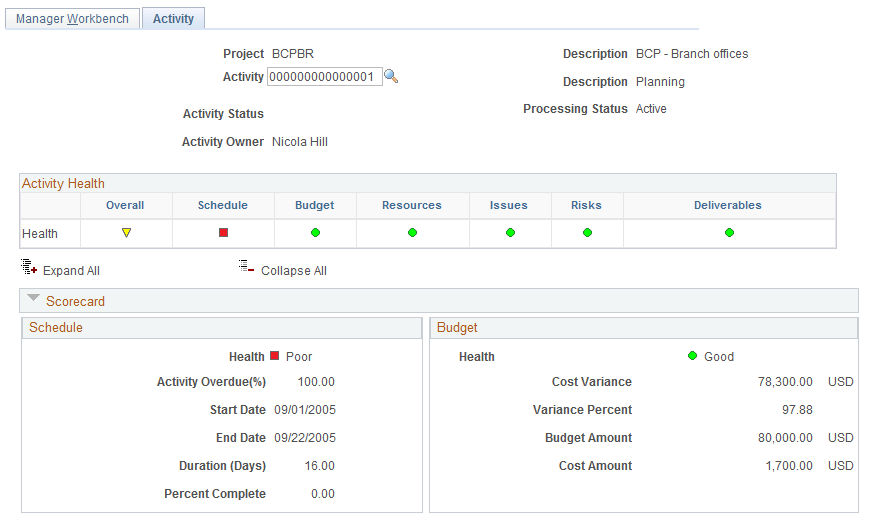
This example illustrates the fields and controls on the Manager Workbench - Activity page (2 of 2). You can find definitions for the fields and controls later on this page.
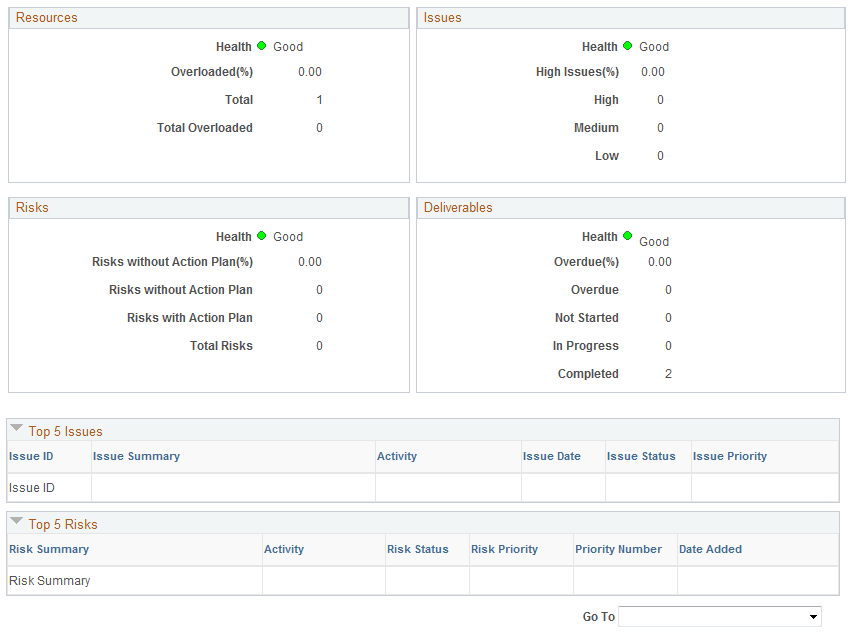
This page provides a summary of activity data from various components in PeopleSoft Program Management and PeopleSoft Project Costing. Use the Activity field to specify the activity for the data you want to display. You can specify a summary or detail activity. For a summary activity, the system sums or averages its detail activities for all calculations. For example, the budget cost of a summary activity is the sum of the budget costs of all child activities and the summary activity schedule health is an average of the activity schedule health values.
Field or Control |
Description |
|---|---|
Activity |
Select the activity ID for which to display the workbench information. You can select from any summary or detail activity within the project. |
Activity Status |
Displays the current activity status that is defined on the Status page for activities. |
Processing Status |
Displays the current processing status that is defined on the Activity Definitions - General Information page. |
Activity Owner |
Displays the current activity owner that is defined on the Activity Definitions - General Information page. |
Activity Health
Field or Control |
Description |
|---|---|
Overall |
Displays the visual indicator to identify the overall activity health that the system calculates using the weighted average of the health indicators of scorecard components. The weight percent values are specified on the Program Management Options page |
Schedule, Budget, Resources, Issues, Risks, and Deliverables |
Displays a colored visual indicator to identify the activity attribute health that is calculated by the system. |
|
Click to expand all of the sections on the page. |
|
Click to collapse all of the sections on the page. |


Scorecard - Schedule
This scorecard displays detailed information regarding the schedule for this activity. The system calculates these values in real time each time you access this page.
Field or Control |
Description |
|---|---|
Health |
Displays a color visual indicator to identify the activity schedule health based on the alert and warning percentages that are specified on the Program Management Options page. |
Activity Overdue(%) (activity overdue percentage) |
Displays the percentage of overdue activities, which is calculated as ((Number of Overdue Activities) ÷ (Total Activities) × 100. |
Duration |
The activity duration, in days. For summary activities, the system displays 0. |
Percent Complete |
The percentage of the activity that is complete. |
Scorecard - Budget
This scorecard displays detailed information regarding the budget for this activity. The system calculates these values in real time each time you access this page.
Field or Control |
Description |
|---|---|
Health |
Displays a color visual indicator to identify the activity budget health based on the budget alert criteria on the activity Budget Alert page. If there is no budget alert set up for this activity or this is not a cost activity, the system displays good health. |
Cost Variance |
Displays the difference between the budget amount and cost amount, which is calculated as (Budget Cost) – (Actual Cost) . If this is not a cost activity, then the systems displays 0. |
Variance Percent |
Displays the variance percentage, which is calculated as ((Budget Amount) − (Cost Amount)) ÷ (Budget Amount)) × 100. If this is not a cost activity, then the systems displays 0. |
Budget Amount |
Displays the budget amount, which is calculated as the sum of all transactions for the selected activity. If this is not a cost activity, then the systems displays 0. |
Cost Amount |
Displays the cost amount, which is calculated as the sum of all transactions for the selected activity. If this is not a cost activity, then the systems displays 0. |
Scorecard - Resources
This scorecard displays detailed information regarding activity resource health. The system calculates these values in real time each time you access this page.
Field or Control |
Description |
|---|---|
Overloaded(%) (overloaded percentage) |
Displays the percentage of resources that have overbooked schedules on this activity, which is calculated as ((Number of Overloaded Resources) ÷ (Total Resources) × 100. |
Total |
Displays the number of resources that have been assigned to this activity. |
Total Overloaded |
Displays the number of resources that have been assigned to this activity and are overbooked. |
Scorecard - Issues
This scorecard displays detailed information regarding issues for this activity. The system calculates these values in real time each time you access this page.
Field or Control |
Description |
|---|---|
High Issues(%) (high issues percentage) |
Displays the percent of issues for this activity that are high priority calculated as ((Number of High Priority Issues) ÷ (Total Number of Issues) × 100. |
Scorecard - Risks
This scorecard displays detailed information regarding activity risks. The system calculates these values in real time each time you access this page.
Field or Control |
Description |
|---|---|
Risks without Action Plan(%) (risks without action plan percentage) |
Displays the percent of risks for this activity that do not have an associated action plan, which is calculated as ((Number of Risks without an Action Plan) ÷ (TotalNumber of Risks) × 100. |
Scorecard - Deliverables
This scorecard displays detailed information regarding deliverables for this activity. The system calculates these values in real time each time you access this page.
Field or Control |
Description |
|---|---|
Overdue(%) (overdue percentage) |
Displays the percentage of deliverables for this activity that are overdue, which is calculated as ((Number of Overdue Deliverables) ÷ (Total Number of Deliverables) × 100. |
Top 5 Issues
Use this section to view the top five unresolved issues sorted by priority—highest to lowest, and age—oldest to newest, for this activity.
Top 5 Risks
Use this section to view the top five risks sorted first by risk status, risk priority—highest to lowest, then priority number—lowest to highest, for this activity. This data is specified on the Project Risk page.