5 Developing the Home Page
Use Page Designer to create a chart of project tasks and a report that details outstanding tasks on your app’s home page.
About This Lesson
In this lesson, you are introduced to the two primary means of development: Page Designer and the Application Runtime ("runtime " for short).
In Page Designer, use the Rendering tree and Layout tab to add new regions to the Home page. Then, use the Property Editor to edit a wide array of attributes for region and page components, including SQL statements and appearance options.
In the runtime, you use the Developer Toolbar to make changes on the page immediately and to quickly shift back to Page Designer.
You also use the Shared Components section, which contains elements that you can create once then add to multiple pages within your application after you create them, to update the placeholder icons in the Navigation Menu.
Starting from here:
Basic Projects App Export - Topic 3.sqlIf you have not completed the previous lessons, you can use the appendix "Importing an Application into a Workspace" to import the above SQL script into your workspace and continue working from this lesson forward. You can find this script in the /files subdirectory of where you unzipped the .zip file accompanying this tutorial.
5.1 Navigating to Page Designer from the Application Runtime
At the end of the previous lesson, you ran the application from Page Designer. Doing so opened the Calendar page of the application runtime in a window in your web browser.
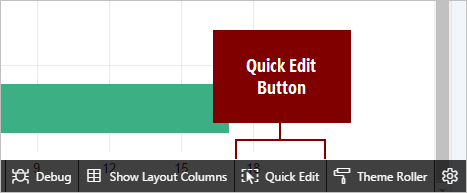
Note that when you run a desktop application from App Builder, the Runtime Developer toolbar displays at the bottom of any editable running page:
Description of the illustration GUID-F94050CA-633D-4A5D-B310-0DA71943DBAB-default.png
You can use the Developer toolbar to quickly edit the current application or currently running page. The Developer Toolbar only appears for you and other users with developer-level privileges.
To begin developing the Home page, you could go back to Page Designer and find the Home page in App Builder—or, you can take a shortcut with the Developer Toolbar in the runtime.
To navigate back to the Home page in Page Designer with the Developer Toolbar:
5.2 Adding a Task Overview Chart to the Home Page
Back in Page Designer, you are looking at the bare skeleton of the Home page. Create a chart of the remaining tasks for all projects for your users to see immediately when they log in.
Below the Layout tab is the Gallery, which has three tabs: Regions, Items, and Buttons. Each Gallery tab contains elements that can be added to an application page by right-clicking the element and selecting the Add To function to place it.
Page Designer features several ways for you to interact with the page content, including dragging objects with the mouse in the Layout tab.
To add a chart to a page:
5.3 Editing a Chart Region with the Property Editor
Next, you must configure the chart region, which includes updating things such as the name.
You must update a number of attribute fields in the Property Editor every time you configure a new region. The more complex the region, the more fields you must configure. Some fields already contain default placeholder content, such as Title - New.
Select the chart region and edit its default values in the Property Editor.
To change the name of a chart region:
Next, resize the chart by editing the appearance template in the Property Editor.
To change the Template Options of a region:
Next, configure the chart by selecting its Attributes item in the Rendering tab and editing it in the Property Editor.
So far, you have configured the properties of a region in the Property Editor. These properties control how the region displays on the page in relation to the rest of the regions on the page.
Next, you modify the Attributes of a region by selecting its Attributes folder in the Rendering tree. Attributes are specific to the region type (in this case, a chart region) and control the internal characteristics of the region. For example, you choose the chart type (bar chart), the orientation (vertical), and the axis labels in the Attributes.
To edit the chart’s region attributes:
5.4 Defining the SQL Query of a Chart
Finally, you must define the SQL query of the chart to pull in data from the DEMO_PROJECTS table in the database.
The SQL query is the dynamic part of the chart. As your users update their progress in the app, the chart reflects those changes and updates each time that a user refreshes the page.
You define two queries for this chart. Both query the IS_COMPLETE_YN column of the DEMO_TASKS table, but the first displays items marked Y (for yes) while the second displays items marked N (for no). Your users populate the IS_COMPLETE_YN column when they indicate whether a task is complete in the app.
Tip:
Data series are contained in the Series folder in the Rendering pane. Currently, the New series appears with a red X next to it.
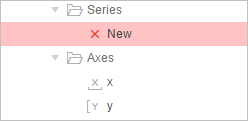
Description of the illustration GUID-099ABFE2-FAD0-47BD-BEB8-8BD1707CA3A1-default.png
This is an error message to indicate that a required element is defined improperly (in this case, because you have not entered the query yet). Also note that the Messages tab of the central pane indicates that three system messages now appear. You can click the Messages tab to view the specific errors and where they appear in Page Designer. In this case, all the messages indicate that a required element for the chart’s data series is missing.
To define the "Yes" SQL query for the Series item in the Rendering pane:
Next, add a second series to apply the second query. Because the queries are so similar, you can duplicate this series and make some minor tweaks instead of defining from scratch.
To duplicate the SQL query and reconfigure it:
Finally, update the axes with appropriate labels.
5.5 Adding a Report of Outstanding Tasks to the Home Page
The chart you added provides an overview of all tasks for all team members, so it only provides information that applies to all users, not individuals. To add a space that shows your users their own outstanding tasks, you can add a classic report.
In Oracle Application Express , a report is the formatted result of an SQL query, which means that Application Express pulls in live information from the database and populates it in a human-readable table. Some reports are read-only, and some are interactive so that end users can manipulate or edit the data.
To add a classic report region:
5.6 Changing Region Appearance Using the Developer Toolbar
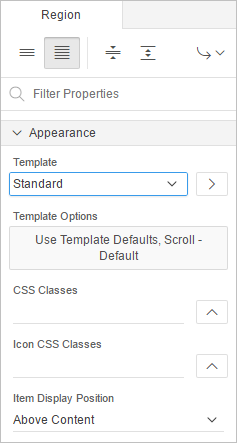
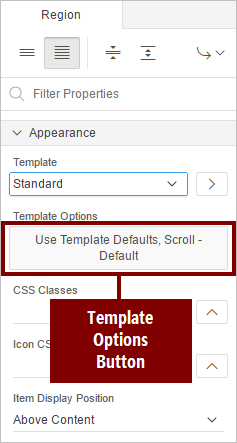
In Page Designer, you can update Template Options by clicking the Appearance: Template Options button in the Property Editor.
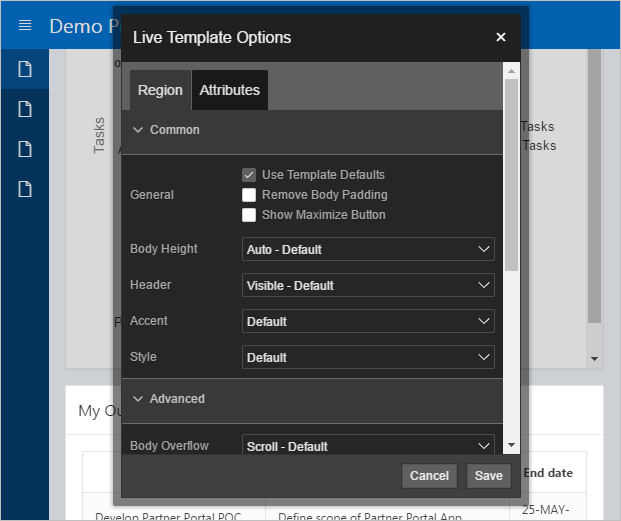
Alternatively, as a developer, you can also update the display characteristics of regions in the runtime environment by invoking Live Template Options with the Developer Toolbar.
You can click the Quick Edit option on the Developer Toolbar to change options and immediately see the effects on the underlying region. Use Quick Edit to edit individual page components, such as regions, items, columns, or buttons.
-
Click within a component to instantly return to Page Designer with the selected component in focus.
-
Click the wrench icon to invoke the Live Template Options dialog for the component and remain in the runtime.
Tip:
To cancel a Quick Edit, click outside a component or press Esc.To edit page elements in the runtime with the Developer Toolbar:
Region Template Options (such as Body Height, Header, and Style) alter the overall presentation of a region. The Region properties determine how the region is displayed.
Some region types also contain Attribute properties (such as classic reports and charts). The Attributes for a region define how the contents of the region are displayed.
You have completed updating the task breakdown report region.
5.7 Adding Icons to the Home Page Sidebar
The icons next to the navigation links in the sidebar on the top-left of the page are blank placeholders (you may need to click the menu icon to expand the sidebar). This sidebar is a list named the Navigation Menu. As a developer, you should be concerned with both the form and function of your app. While the icons and links in the Navigation Menu are technically functional, updating the placeholder icon for each link to a relevant graphic increases your app’s usability.
All instances of Oracle Application Express come with a large set of icons ready to use for this purpose.
You can update these icons assocaited with the Navigation Menu by editing the list in the Shared Components section of App Builder. Shared Components are objects that can be used across an application. As a best practice, Oracle recommends that you define code once in a shared component wherever possible and then reference that component on different pages.
To update the Navigation Menu icons in Shared Components:
If this were the only change you need to make, you would click the Apply Changes button to save your changes; however, you still need to update the rest of the Navigation Menu entries.
You can also enter the name of the image in Image/Class rather than browse the Images library every time.
You have completed the Home page.
In this lesson, you learned how to use Page Designer to add and enhance page components on a page. You also used Live Template Options to improve the appearance of regions. Finally, you used Shared Components to update a component that appears on all pages (Navigation Menu).
Proceed to the next lesson.
