Inserting Graphs
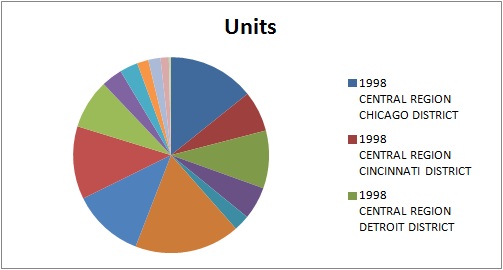
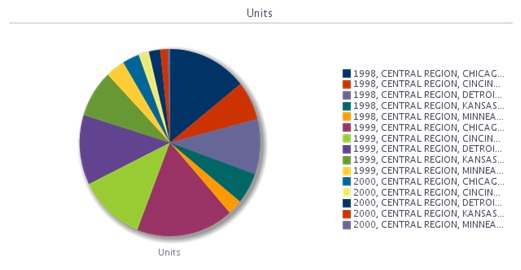
When inserting graphs, Oracle Smart View for Office attempts to map the Oracle Business Intelligence Enterprise Edition graph into a chart type supported by Microsoft Office 2007 and later. Further, Smart View attempts to match visual effects, such as 2D or 3D, and other graph properties such as canvas size, axis scale, data format, and formatting in terms of font styles and colors.
When a matching chart type is not available, the graph view can only be inserted as image.
See Supported Oracle BI EE Chart and Object Types and Unsupported Oracle BI EE Chart and Object Types.
To insert a graph:
Once inserted, whether as an Excel chart or as an image, both types of graphs shown can be resized by stretching them.

