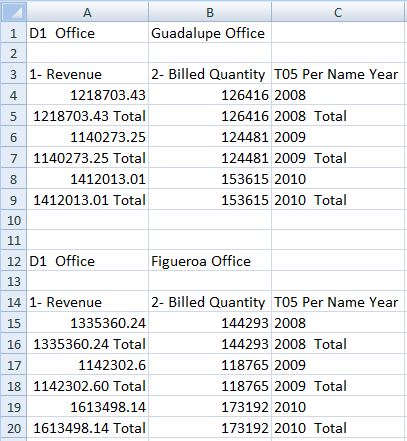
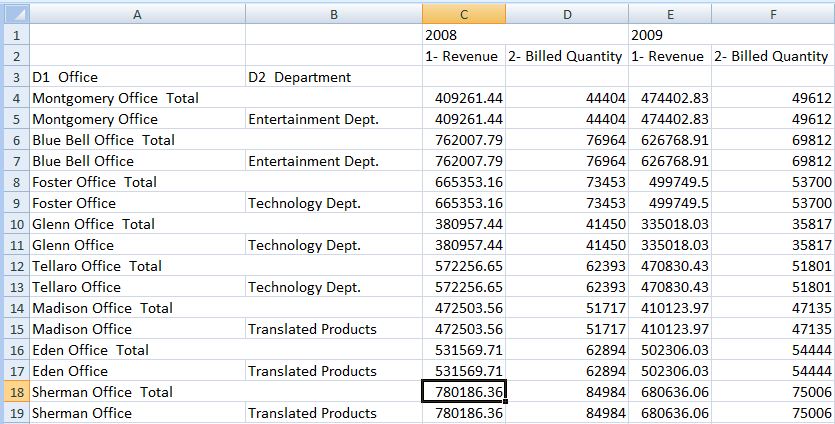
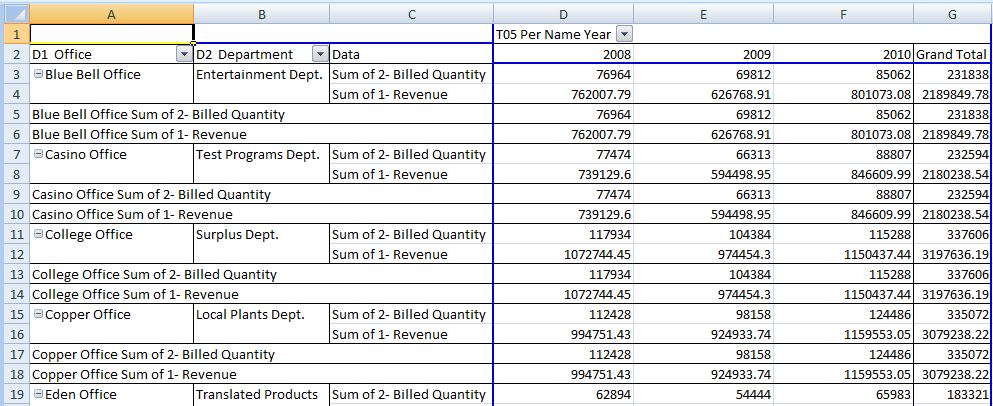
Inserting Tables and Pivot Tables
The maximum number of rows and columns that you can insert depends on the version of Excel you are using. See Microsoft Excel documentation for worksheet size limits.
To insert a table or pivot table:
You can edit tables and pivot tables as described in Editing Views Created in Oracle BI EE.
Note:
When pivot tables that contain embedded pivot charts are inserted into Smart View, the embedded pivot charts are not imported. You can either use Excel to create a pivot chart based on an inserted Excel pivot table or use Oracle Business Intelligence Answers to create a new chart view and insert that view using Smart View.
-
To create a pivot chart based on the inserted native Excel pivot table, complete these steps:
-
In Smart View, click in the Excel pivot table and select the Excel Options ribbon.
-
From the Tools group, click the PivotChart button.
-
In Insert Chart, select a chart style and then click OK.
-
-
To create and insert a separate chart view:
-
In BI Answers, create a new, separate chart view object.
-
In the Office application, use Smart View to insert the newly-created chart view.
-


