Viewing Approval Insights
PeopleSoft Approval Insights provides managers and administrators the ability to view and analyze approval data using PeopleSoft Insights visualizations.
Based on user privileges, a user can access the visualizations delivered on the following dashboards to monitor approval data:
- (Managers) Approval Insights dashboard
- (Administrators) Admin Approval Insights dashboard
Note:
The dashboards use the security defined on the Approval Insights Security Page display permitted data to the user.
The Approval Insights dashboards are built on the PeopleSoft Insights platform, which relies on an underlying analytics engine and search engine.
- The Manager Approval Insights dashboard is built on approval data for a manager's direct and indirect reports and uses search index HCSC_APRV_INSIGHTS.
- The Admin Approval Insights dashboard is built on approval data for the organization and uses search index HCSC_APR_ADM_INSIGHTS.
Prior to using the Approval Insights dashboards, you must first complete the setup configurations. For information on how to set up the Approval Insights tables, see Understanding How to Set Up the Approval Insights Dashboards
This topic lists common elements and controls and discusses the PeopleSoft Approval Insights dashboard.
Understanding PeopleSoft Insights
PeopleSoft Insights is an analytical engine that provides visual reports (visualizations) in the form of charts, tables, graphs and so on. The visualizations are based on queries that retrieve data from the PeopleSoft Search Framework.
These videos provide an overview of the PeopleSoft Insights feature:
Video: Insights with PeopleSoft
Video: PeopleSoft HCM Insights
Video: Image Highlights, PeopleSoft HCM Update Image 51; Approval Insights for Managers
For information on Insights dashboards, see:
-
Understanding PeopleSoft Insights Using PeopleSoft Search Framework
-
PeopleTools Search Technology: “Monitoring PeopleSoft Search Framework and OpenSearch” and “Working with Insights Dashboards for PeopleSoft Application Data” documentation.
Pages Used to View Approval Insights
| Page Name | Definition Name | Usage |
|---|---|---|
|
HC_APRV_INSIGHTS_FL (this is the cref for the tile) |
As a manager, access and view analytics related to approval requests that fall under your hierarchy. |
|
|
HC_APRV_INSIGHTS_FL |
As a manager, review and analyze approval data that falls under your management using visualizations. |
|
|
HC_ADM_APPROVAL_INSIGHTS_LP_FL (this is the cref for the tile) |
As an administrator, access and view analytics related to approval requests for the organization. |
|
|
HC_ADMIN_APRV_INSIGHTS_FL |
As an administrator, review and analyze approval data for the organization using visualizations. |
Common Elements and Controls
This section lists the common elements and controls that are used in Insights analytics.
When you select filters or chart items, or modify the date range, PeopleSoft Insights dynamically updates all visualizations using the source from the index.
Note:
For optimal performance, only the first 500 rows of data are displayed on the Insights dashboard. Use filters to refine the set of data you wish to visualize using the dashboard.For more information on working with PeopleSoft Insights and filters, see PeopleTools: Search Technology, “Working with Insights Dashboards for PeopleSoft Application Data” documentation.
Search and Filter Options:
Note:
Filtering options apply to all visualizations, which allows users to drill down on all the charts at once.
| Field of Control | Definition |
|---|---|
|
Search field |
Enter a query to filter data, if applicable. |
|
|
Enter criteria to filter data on the visualizations. You can apply filters in a number of ways:
Added filters are displayed next to the + Add filter link for reference. For example, when you click a chart item, the filter is automatically added to your filters list. When you click a chart item, such as the bar item for requests by manager, the system will prompt you to add the supervisor's name and the approval status. since this item consists of more than one filter. Click this icon (Change all filters) for a list of actions that can be performed on all filters. For example, disable them temporarily, remove them permanently, or invert inclusion (show data that does not meet filter criteria). Select a filter item for a list of similar actions that can be performed on it individually. |
|
|
Click to select a different time period for the analytics that falls within the look back period defined during setup. You can enter dates manually, or choose from commonly used date ranges provided the system as well as recently used selections. When a new period is selected, all visualizations are refreshed automatically to reflect that change. If you have selected a commonly used date range, for example, This week, or Last 30 days, click the Show dates link to view the approximate date period in relation to the current date. For example, the current date is November 1 and the selected date range is Year to date. Clicking the Show dates link displays ~ 10 months ago —> now, which indicates that the selected date range started from approximately 10 months ago and ends on the current date. |
 (Change all filters) and
  (Calendar) or
 Visualization Options:
When you pause over a visualization, the Options and Legend icons (if applicable) are displayed on the top right and bottom left corners respectively. Use them to inspect the chart or table and view the details of that visualization and toggle the legend display.
| Field or Control | Definition |
|---|---|
|
|
Click the Options icon to select one of these options:
|
|
|
Click this icon to hide or display the legend for the chart, if available. You can click an item in the legend to change its color, or add it as a filter (if applicable). |
|
Chart item (bar, pie slice, and so forth) |
Pause over a chart item, such as a bar item or pie slice, to view a summary of details for that item. Select a chart item to add a filter for it to apply to all visualizations. |
 (Options) icon
 (Toggle legend) icon
Approval Insights Tile (for Managers)
Managers use the Approval Insights tile to access and view analytics related to approval requests that fall under their hierarchy.
Navigation:
The Approval Insights tile is located on the Manager Self Service Homepage.
This example illustrates the Approval Insights tile.
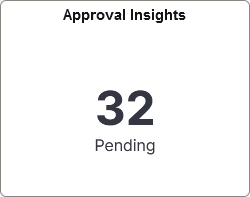
This tile displays the number of pending approval requests for all approvers under the logged in manager’s hierarchy.
Select this tile to access the Approval Insights Dashboard (for Managers) and analyze visualizations related to approval information.
Approval Insights Dashboard (for Managers)
Managers use the Approval Insights dashboard to review and analyze approval data that falls under your management using visualizations.
Navigation:
- Select the Manager Approval Insights option from the Insights Catalog Navigation Collection.
Note:
You must be assigned the Manager role to view this dashboard.
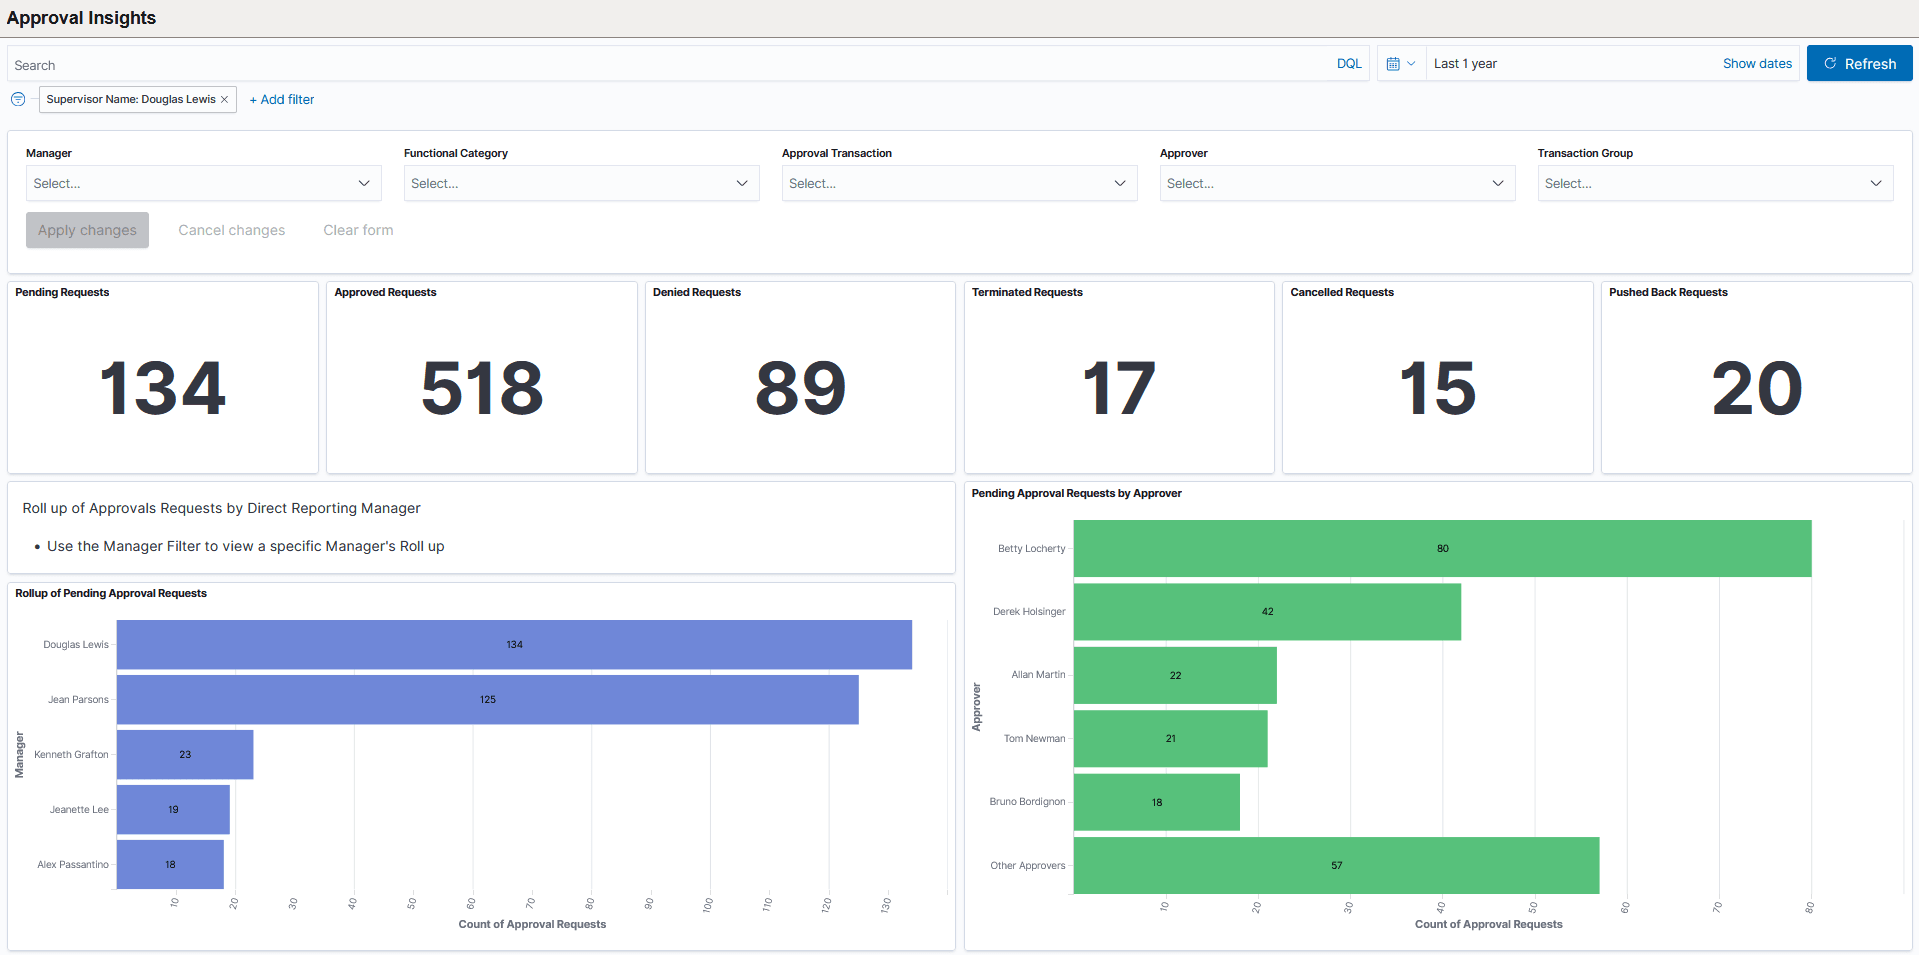
This example illustrates the Approval Insights dashboard (1 of 3).
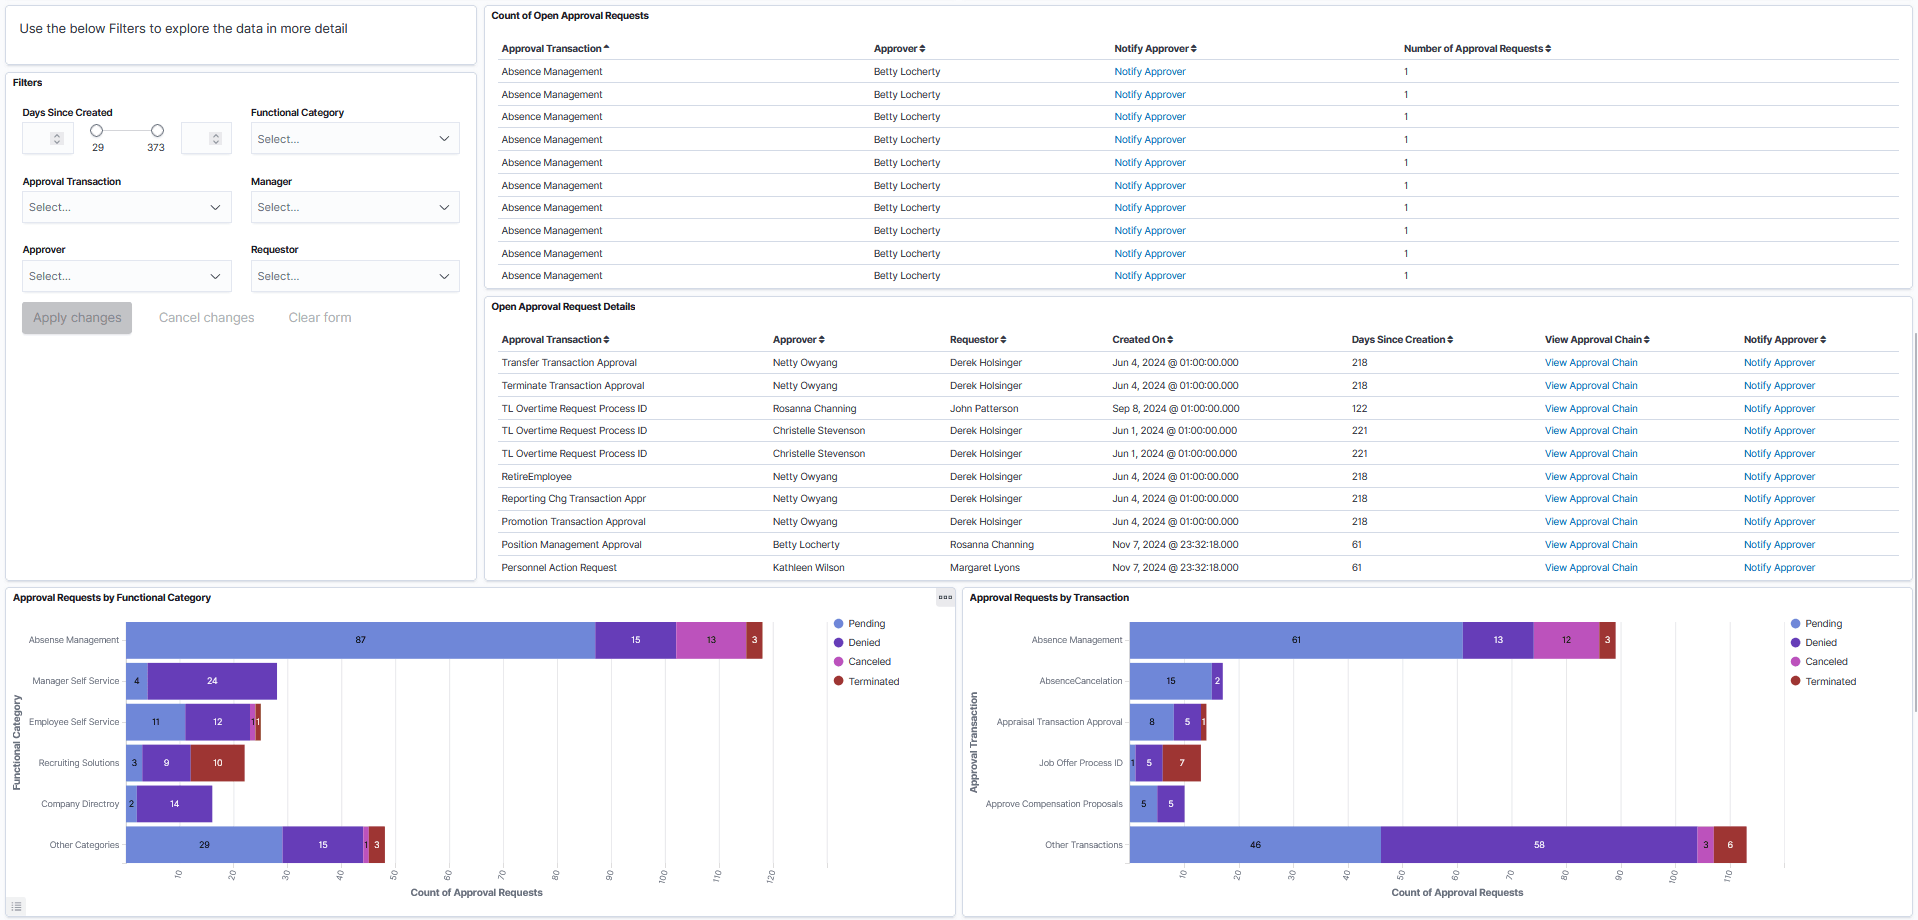
This example illustrates the Approval Insights dashboard (2 of 3).
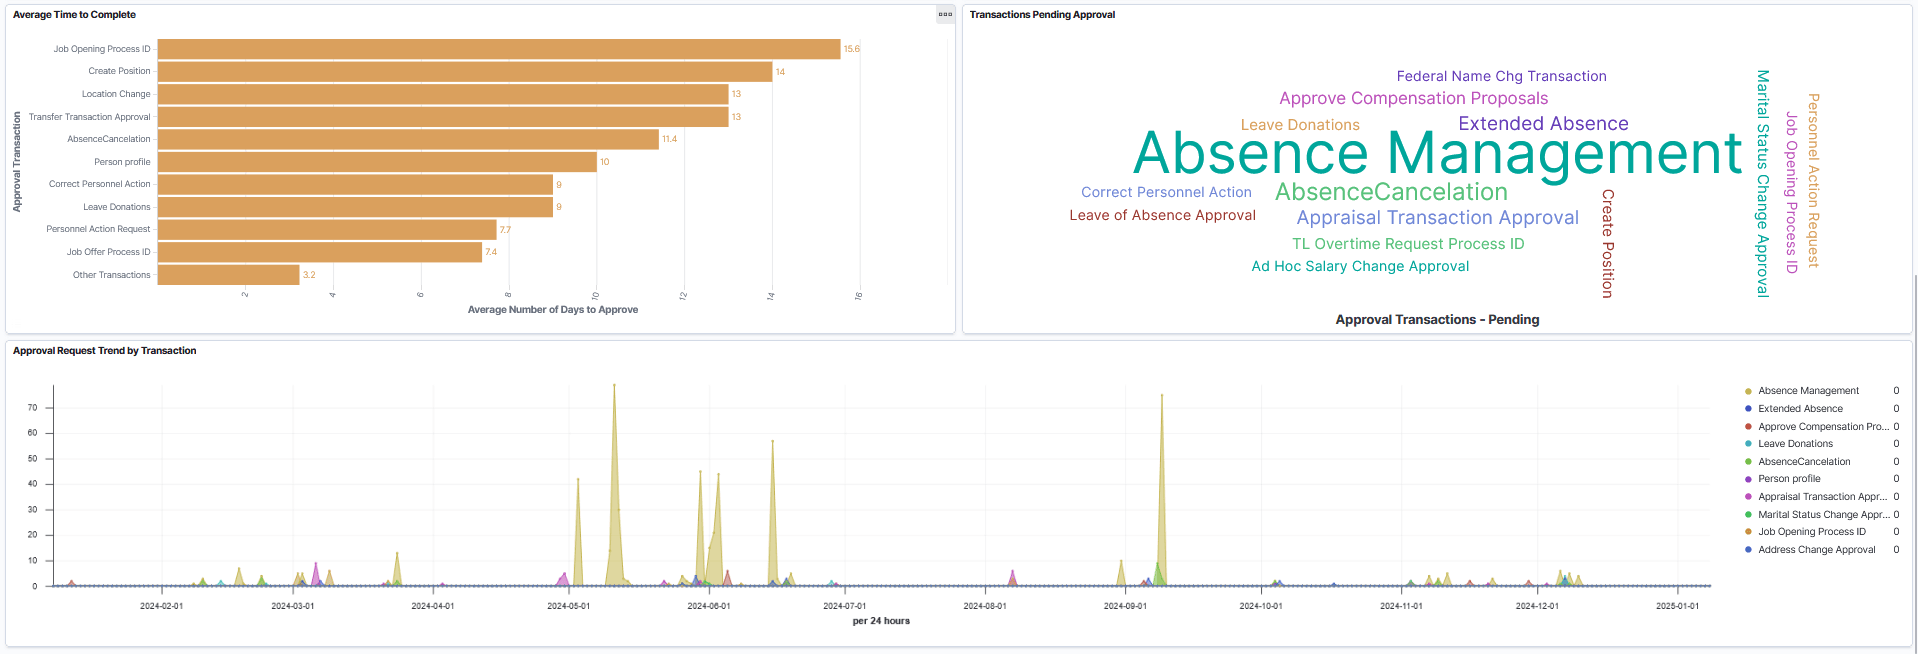
This example illustrates the Approval Insights dashboard (3 of 3).
WARNING:
PeopleSoft Insights dashboards may not render properly if you access them using unsupported platforms.
Approval Insights - Filters
This section contains the following filters to sort data.
| Field or Control | Description |
|---|---|
|
Filters:
|
Filters are applied by the order of filter fields. For example, by manager, followed by functional category, then by approval transaction, then so on. |
For a list of common filter controls available for the Admin Approval Insights dashboard, see the Common Elements and Controls section in this documentation.
Approval Insights - Visualizations
The Approval Insights dashboard provides you with the following collection of interactive visualizations to view and analyze approval data based on permissions, the criteria specified and Approval Insights setup (see Setting Up Approval Insights Tables).
| Visualization | Description |
|---|---|
|
Metrics:
|
These panels display a count of the specified approval statuses that fall within in the specified filter criteria. |
|
Rollup of Pending Approval Request by Manager horizontal bar chart |
This visualization displays the count of pending requests with the approvers in the logged manager’s hierarchy. |
|
Pending Approval Requests by Approver horizontal bar chart |
This visualization displays the number of pending approval requests by approver. It shows the top five (5) approvers with the highest number of requests first. Select the Other Approvers bar to view the next set of five approvers. Selecting this will update the entire dashboard, excluding approvers that appear with the higher number count. |
|
Filters
|
This panel displays filters similar to those at the top of the page. Select filters and select the Apply changes button to update the visuals. See also Common Elements and Controls. |
|
Count of Open Approval Requests grid |
This grid displays the number of requests for an approval transaction and an approver. Select the Notify Approver link to send the approver a reminder to review the request. |
|
Open Approval Request Details grid |
This grid displays details on open approval requests, including the transaction type, approver, requestor, date of submission, and the number of days that have passed since the request was made. You can review the approval chain for a request as well as notify the approver to review the individual request. |
|
Approval Request by Functional Category horizontal bar chart |
This visualization displays the number of pending cancelled, denied, and terminated approval requests by categories. The functional categories are defined on the Define Functional Category Page and Map Functional Category Page. It shows the top five (5) categories with the highest number of requests first. Select the Other Categories bar to view the next set of five categories. Selecting this will update the entire dashboard, excluding categories that appear with the higher number count. |
|
Pending Approval Requests by Transaction horizontal bar chart |
This visualization displays the number of pending cancelled, denied, and terminated approval requests by transaction. It shows the top five (5) transactions with the highest number of requests first. Select the Other Categories bar to view the next set of five categories. Selecting this will update the entire dashboard, excluding categories that appear with the higher number count. |
|
Average Time to Complete horizontal bar chart |
This visualization displays the average number of days it takes to approve requests, sorted by approval transaction type. The list shows the top ten highest durations. |
|
Transaction Pending Approvals tag cloud |
This tag cloud visualization displays the pending approval transactions. The bigger the font size, the larger the number of pending requests are associated with the transaction type. This tag cloud helps easily filter the entire dashboard by a specific pending approval type. |
|
Approvals Requests Trend by Transaction graph |
This visualization shows approval request trends by month and year (as of January 1), comparing how many approval requests have been submitted for a specific approval transaction. By default, the dashboard shows the last year of data. |
Admin Approval Insights Tile
Administrators use the Admin Approval Insights tile to access and view analytics related to approval requests for the organization.
Navigation:
You can use personalizations to add the Admin Approval Insights tile to a homepage.
Note:
You must be assigned the HR Administrator role to access the tile.
This example illustrates the Admin Approval Insights tile.
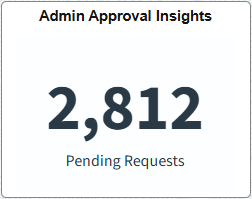
This tile displays the number of pending approval requests for all approvers viewable to the logged in administrator.
Select this tile to access the Admin Approval Insights Dashboard.
Admin Approval Insights Dashboard
Administrators use the Admin Approval Insights dashboard to review and analyze approval data for the organization using visualizations.
Navigation
-
Select the Admin Approval Insights option from the Insights Catalog Navigation Collection.
Note:
You must be assigned the Ins Cat Admin Approval Insight role to access the dashboard through Insights Catalog.
-
Select the Admin Approval Insights tile from the homepage you have added the tile
Note:
You must be assigned the HR Administrator role to access the dashboard through the tile. Use personalizations to add the tile to a homepage.
This example illustrates the Admin Approval Insights dashboard (1 of 7).
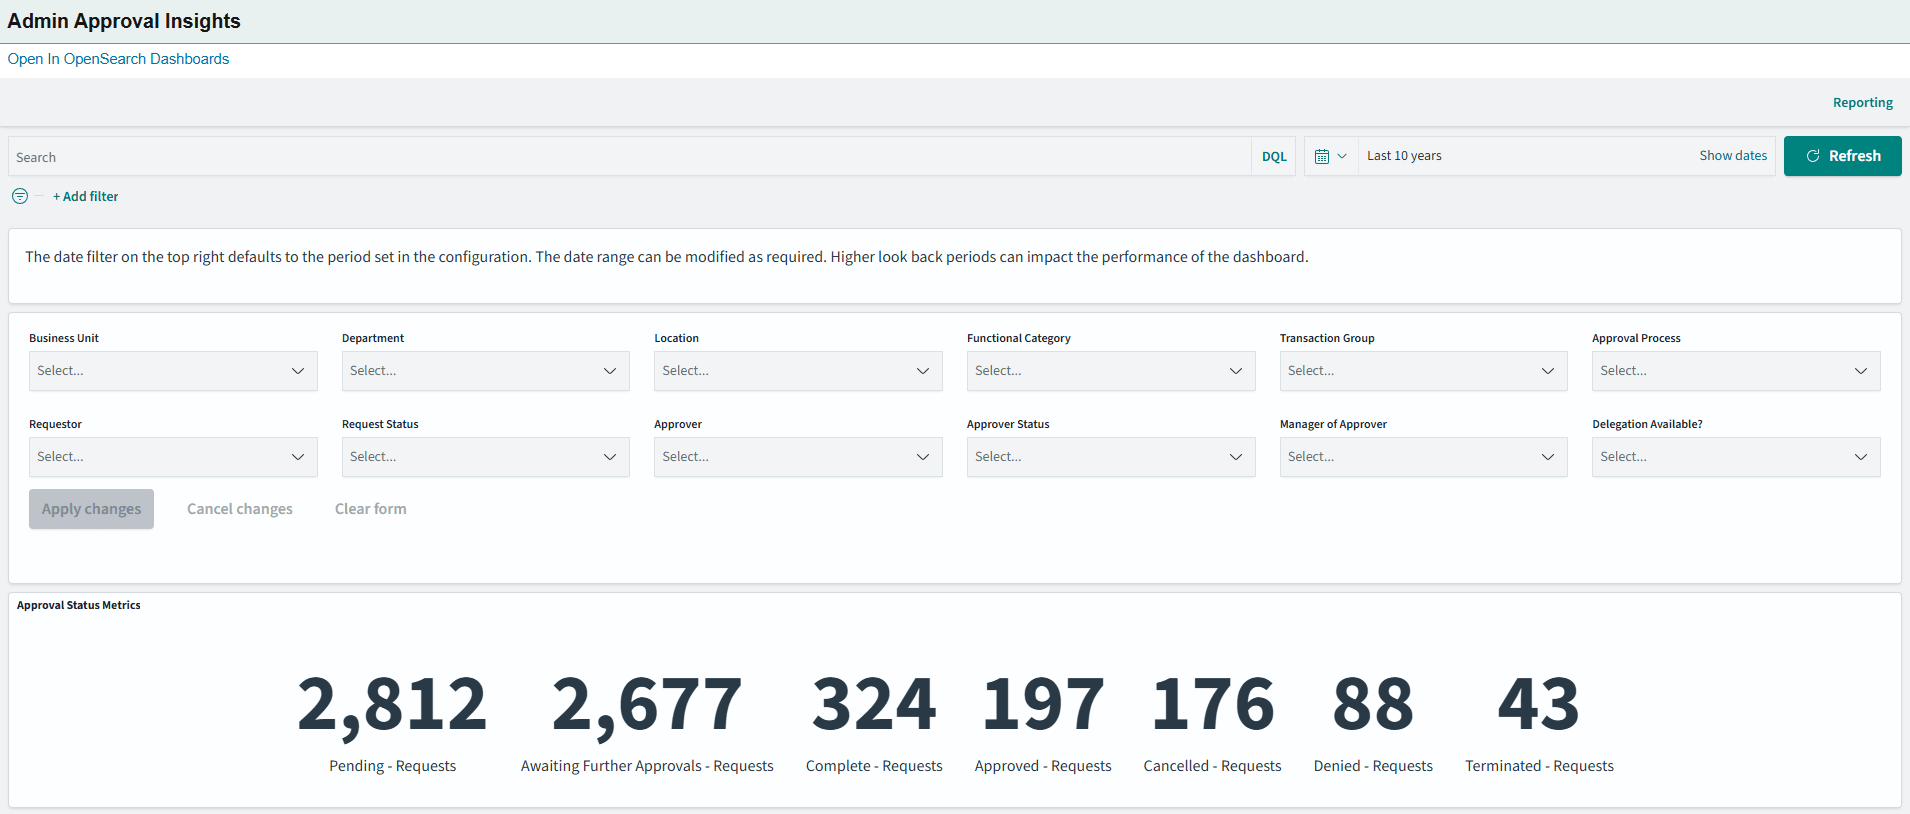
This example illustrates the Admin Approval Insights dashboard (2 of 7).
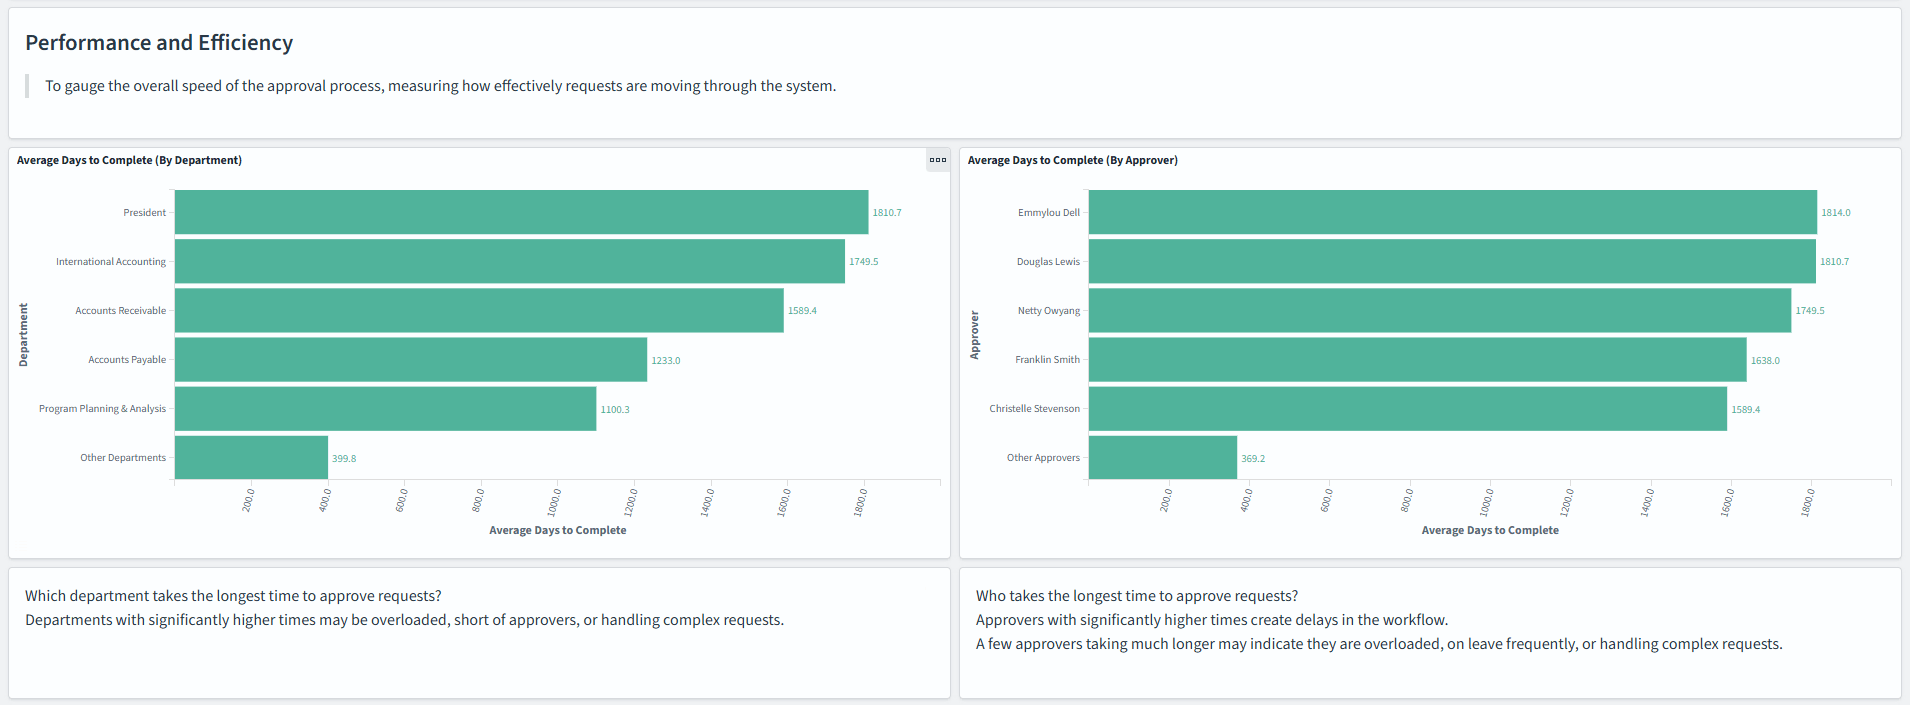
This example illustrates the Admin Approval Insights dashboard (3 of 7).
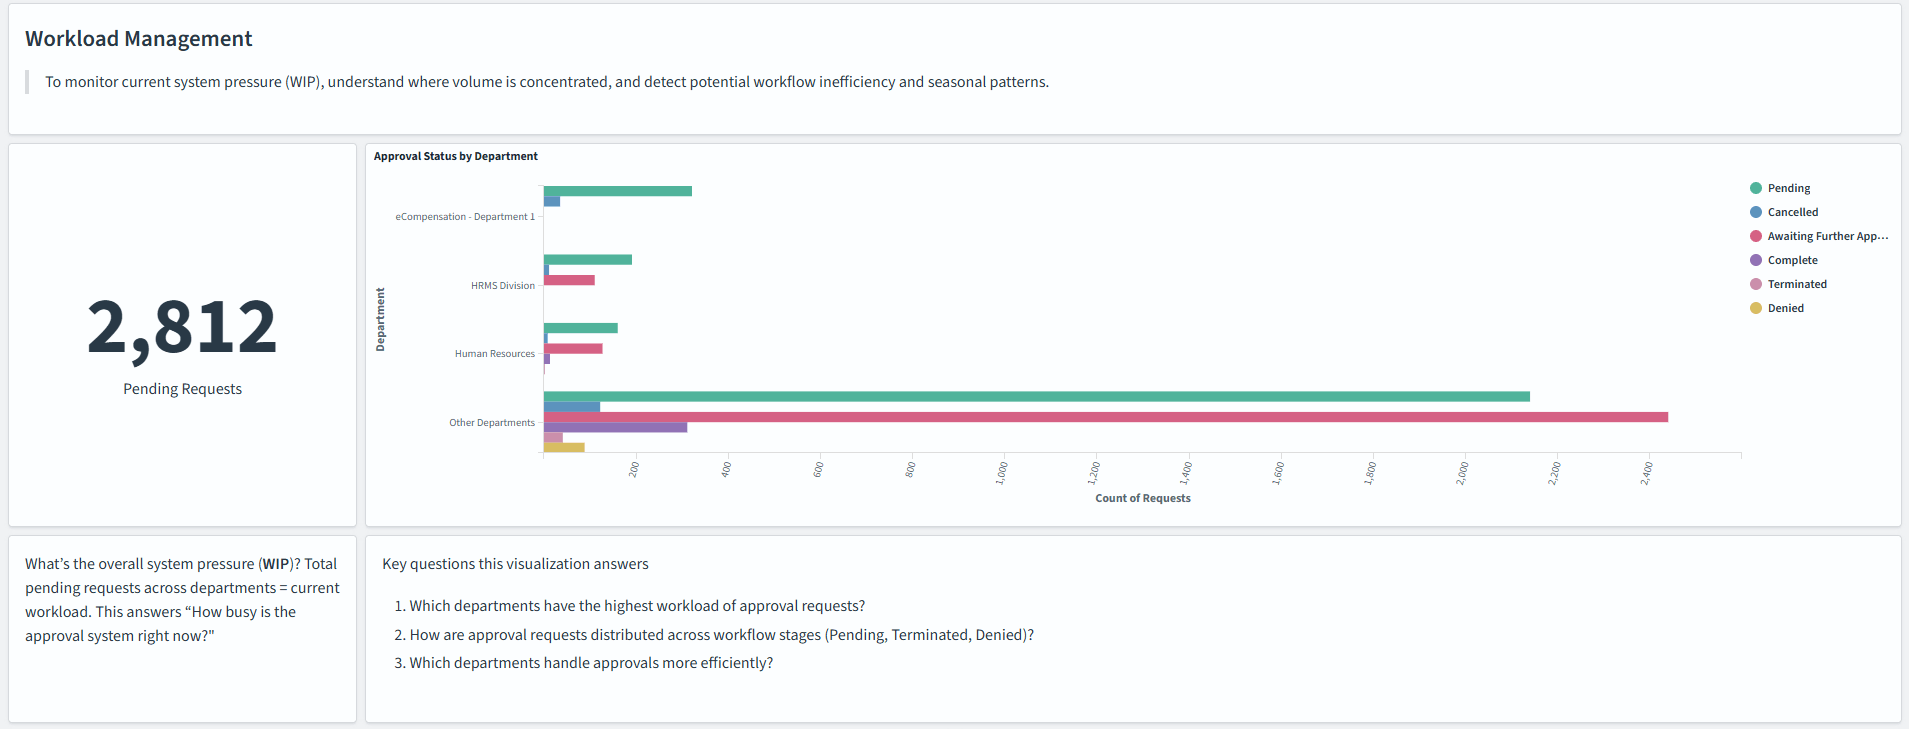
This example illustrates the Admin Approval Insights dashboard (4 of 7).
This example illustrates the Admin Approval Insights dashboard (5 of 7).
This example illustrates the Admin Approval Insights dashboard (6 of 7).
This example illustrates the Admin Approval Insights dashboard (7 of 7).
WARNING:
PeopleSoft Insights dashboards may not render properly if you access them using unsupported platforms.
Admin Approval Insights - Filters
This section contains the following filters to sort data.
| Field or Control | Description |
|---|---|
|
Filters:
|
Filters are applied by the order of filter fields. For example, by business unit, followed by department, then by location, then so on. |
For a list of common filter controls available for the Admin Approval Insights dashboard, see the Common Elements and Controls section in this documentation.
Admin Approval Insights - Approval StatusMetrics
The metrics panel provides you with the following metric counts by approval statuses based on the filter criteria.
| Visualization | Description |
|---|---|
|
Approval Status Metric:
|
This panel displays a count of the different approval statuses that fall within the specified filter criteria. |
Performance and Efficiency Visualizations
The Performance and Efficiency section provides you with the following collection of interactive visualizations to gauge the overall speed of the approval process, measuring how effectively requests are moving through the system.
| Visualization | Description |
|---|---|
|
Average Days to Complete (By Department) horizontal bar graph |
This visualization displays how long, on average, each department takes to complete the approval process. |
|
Average Days to Complete by Approver horizontal bar graph |
This visualization displays how long, on average, each approver takes to complete the approval process. |
Workload Management Visualizations
The Workload Management section provides you with the following collection of interactive visualizations to monitor current workload, understand where volume is concentrated, and detect potential workflow inefficiency and seasonal patterns n the approval process.
| Visualization | Description |
|---|---|
|
Pending Requests metric |
Displays a count of all pending request. |
|
Approval Status by Department horizontal bar graph |
This visualization displays a count of approvals by status for each department. The list displays departments by the largest number of approvals to smallest. Select a bar from the Other Departments item to view more departments. |
|
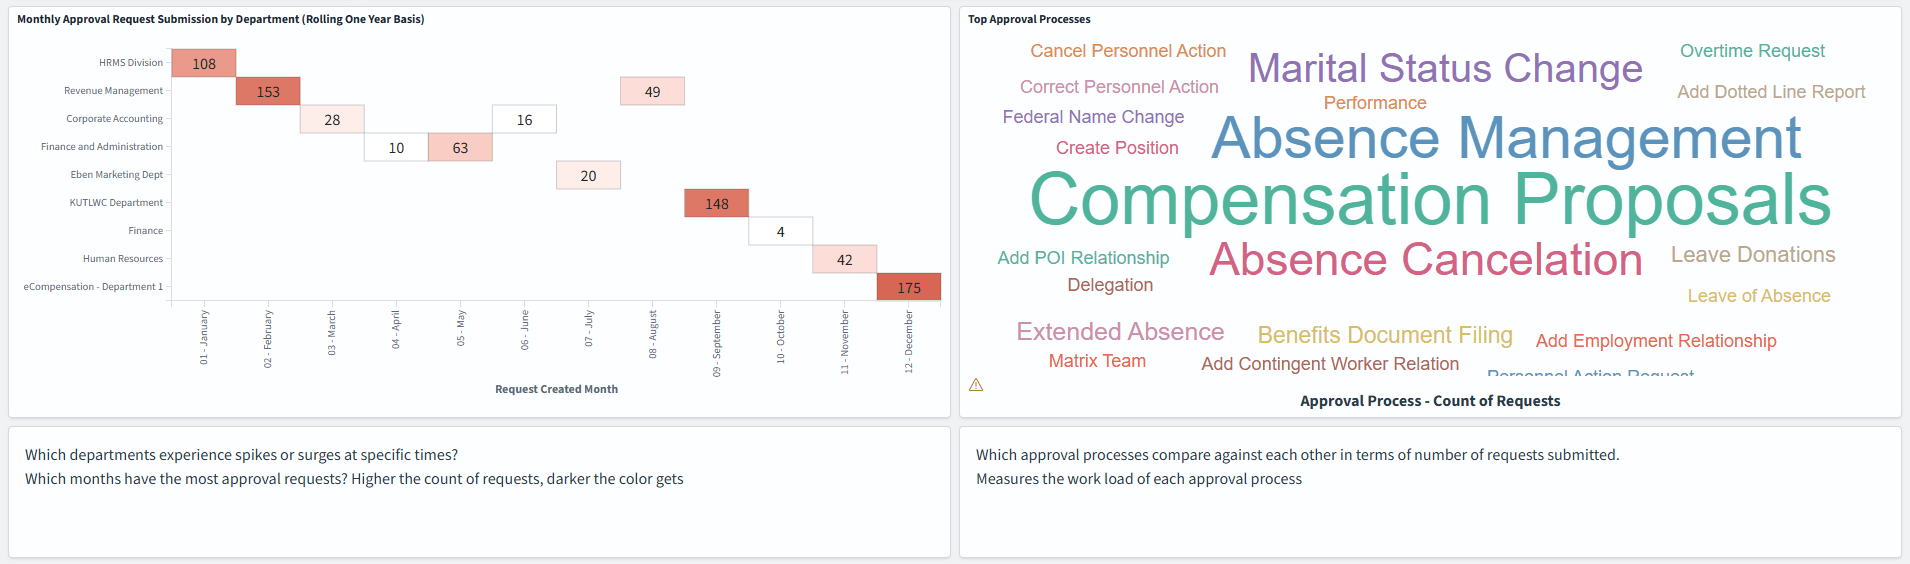
Monthly Approval Request Submission by Department (Rolling One Year Basis) chart |
This visualization displays which department had the highest number of approvals submitted for the month over the last 12 months. The count boxes appear dark when more requests re submitted. |
|
Top Approval Processes tag cloud |
This tag cloud visualization displays the pending approval transactions. The bigger the font size, the larger the number of pending requests are associated with the transaction type. This tag cloud helps easily filter the entire dashboard by a specific pending approval type. |
|
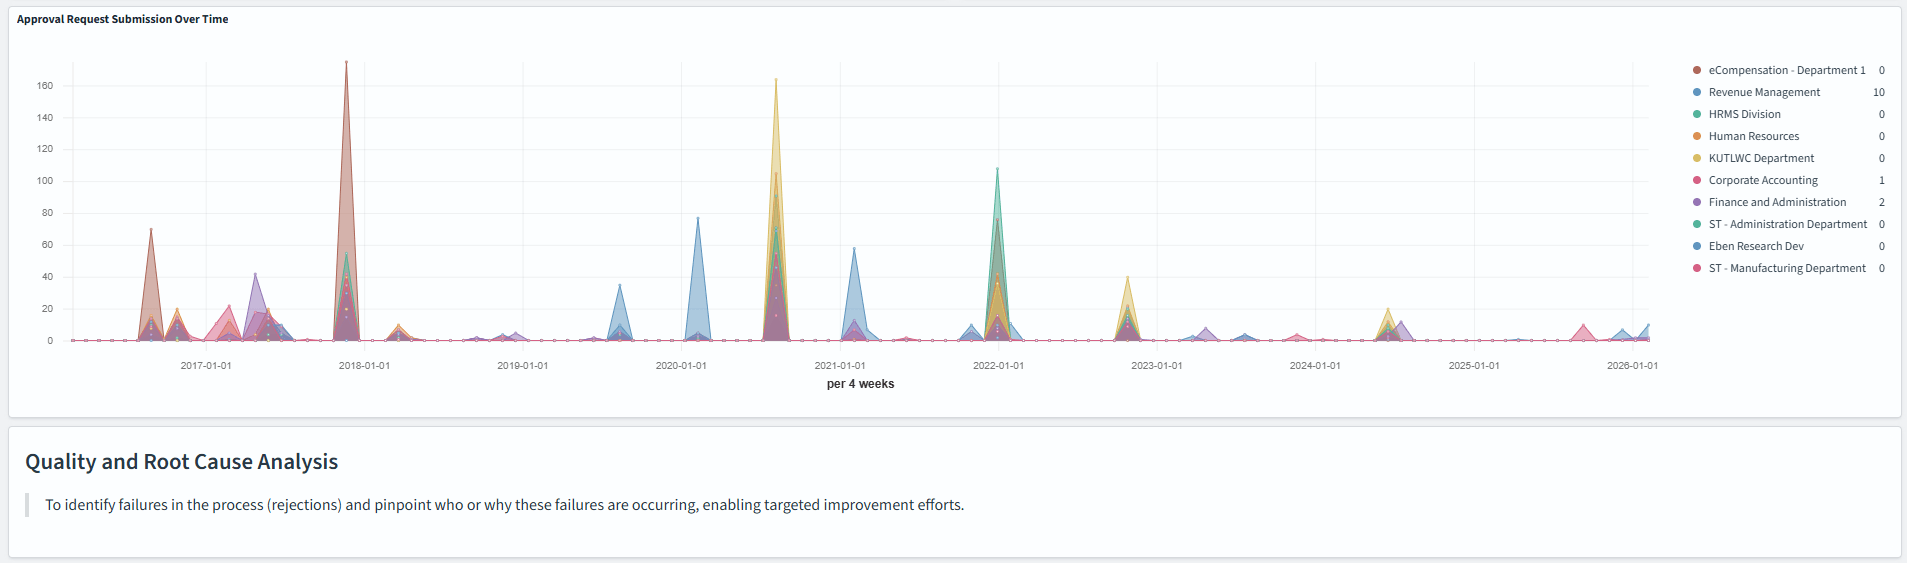
Approval Request Submission Over Time graph |
This visualization shows approval request trends by month and year (as of January 1), comparing how many approval requests have been submitted for a specific approval transaction. By default, the dashboard shows the last 10 years of data. |
|
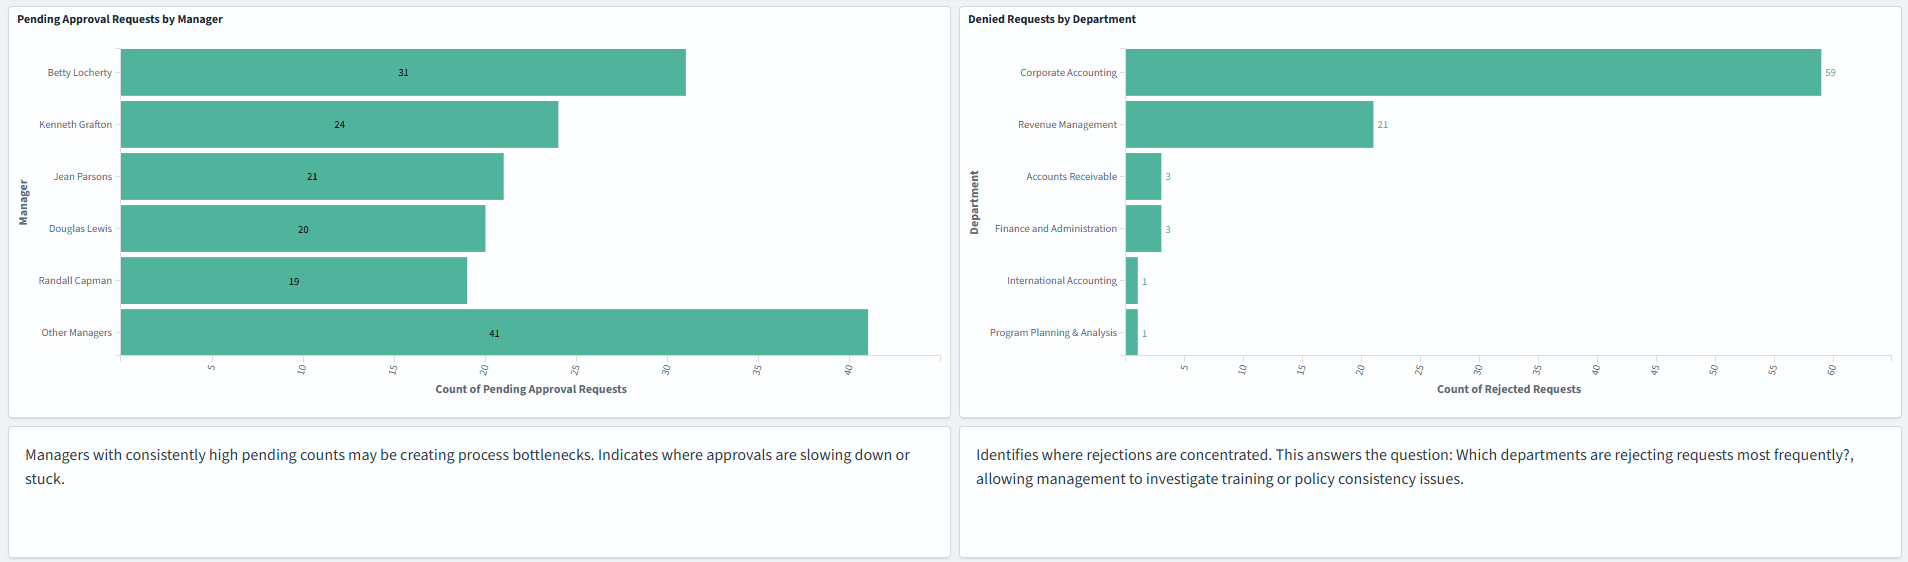
Pending Approval Requests by Manager horizontal bar chart |
This visualization displays the number of pending approval requests by manager. It shows the top five (5) managers with the highest number of requests first. Select the Other Managers bar to view the next set of five managers. Selecting this will update the entire dashboard, excluding managers that appear with the higher number count. |
|
Denied Requests by Department horizontal bar chart |
This visualization displays the number of denied approval requests by department to help identify which departments are rejecting requests most often. It shows the top departments with the highest number of denied requests first. |
|
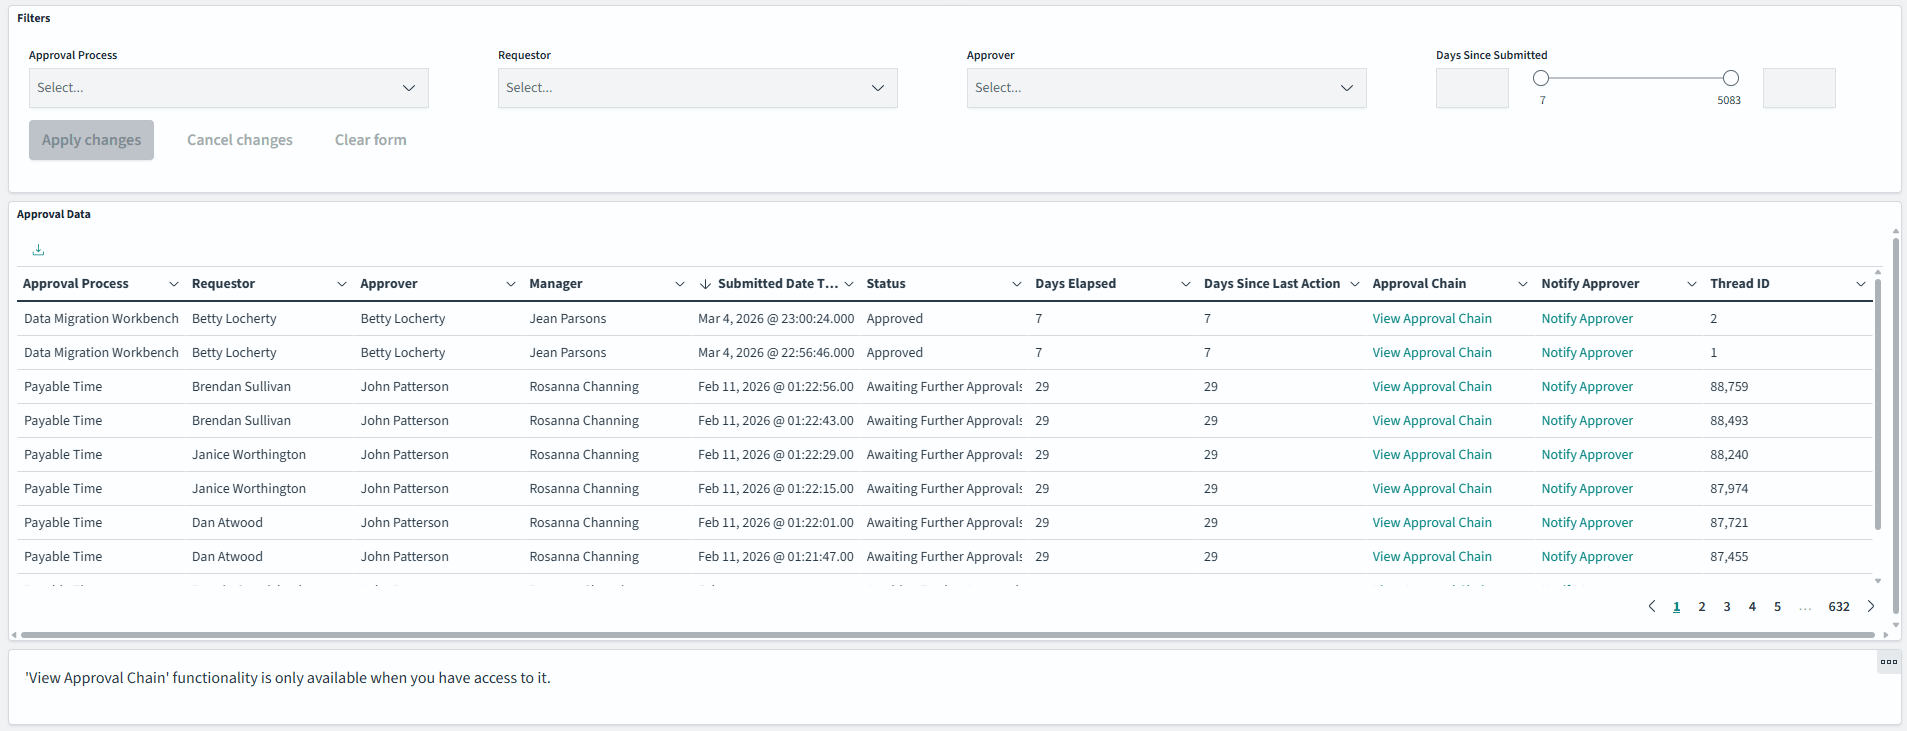
Filters |
This panel displays filters similar to those at the top of the page. Select filters and select the Apply changes button to update the visuals. |
Approval Data Grid
This section displays a detailed grid of employee's that meet the visualization specifications.
| Field or Control | Description |
|---|---|
|
|
Select to export data from the grid into a .csv file format. |
|
Sort column heading |
Select a column heading to sort grid rows by the column value in ascending or descending order. |
|
|
These filter icons appear when you pause next to a field value. These icons are available for all column values in the grid and provide a quick way to add filters to the analytics. Select the Filter for value (+) icon to add the shown field value as a filter to all visualizations. For example, if you select to filter for a Department value, all visualizations will refresh to show employees for that department. Select the Filter out value (-) icon to remove the shown field value from the filter process for all visualizations. For example, if you select to filter out the Human Resources value in the Department column, visualizations will refresh to show information for all departments except Human Resources. Filters can be removed from the Filters area at the top of the page. |
|
View Approval Chain link |
View the approvers and status of a request. |

