Working with My Customization Groups Dashboard
Customization Groups help you organize your Customization Insights into meaningful groups.
It is accessed by administrator and executive level user.
You can group customization by business function, impact, and so on.
This group-based view helps administrators decide which groups need review, ownership, testing, or maintenance action.
Users with Customization Admin and Customization User roles can access this page. For details on assigning roles, see Deploying Insights Dashboards
Select PeopleTools, Lifecycle Tools, Customization Groups, My Customization Groups.
This example illustrates the fields and controls on the Customization Groups Dashboards.
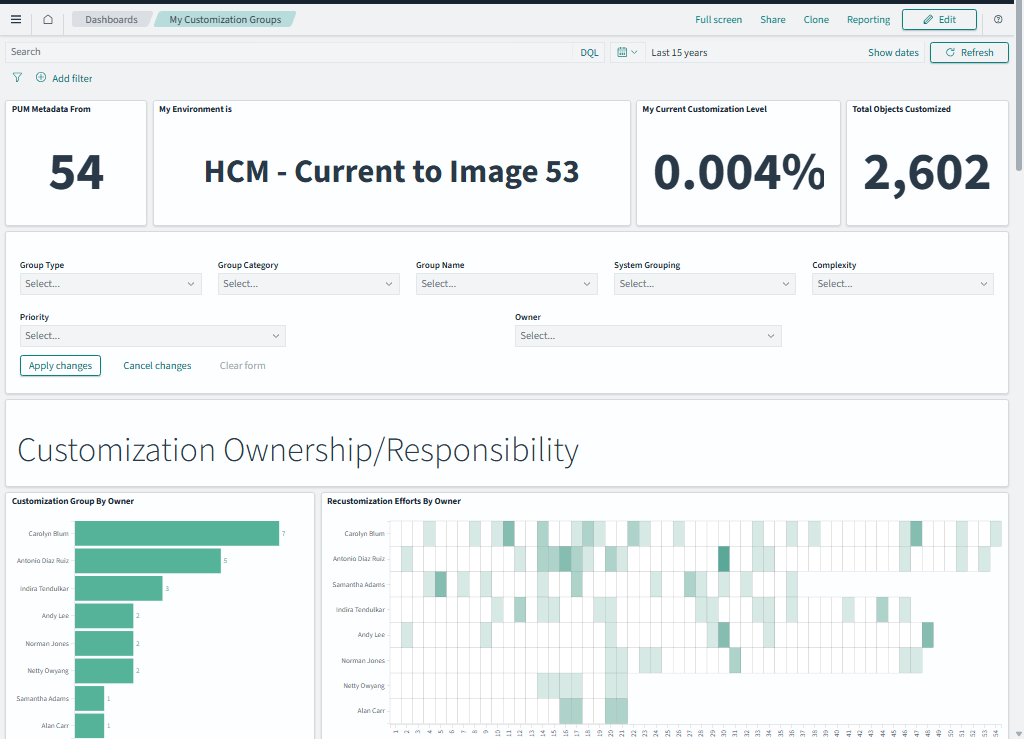
Use the My Customization Groups dashboard to review summary information and analytics for Customization Groups in the selected environment.
| Summary Information Tile | Description |
|---|---|
|
PUM Metadata From |
Displays the PeopleSoft Update Image that supplied the PUM metadata used by the dashboard. PUM metadata is used by LCM Insights to determine how PeopleSoft-delivered maintenance may impact customized objects. |
|
My Environment is |
Identifies the selected product environment and its current maintenance position. For example, HCM- Current to Image 53 indicates that the HCM environment is current through Image 53. |
|
My Current Customization Level |
Displays the calculated customization level for the selected environment. Use this value to understand the overall customization footprint before reviewing detailed Customization Group analytics. |
|
Total Objects Customized |
Displays the number of customized managed objects included in the current dashboard scope. Use this value with the customization level and group-level analytics to understand the size of the customization inventory. |
The various visualizations in this dashboard display data based on these filters:
-
Group Type- Identifies the purpose or source of the group, such as whether the group represents a functional customization, a related object group, a maintenance impact group, project metadata, or a system-generated grouping.
-
Group Category- Use this to review groups by higher-level business or functional area, such as business process, reporting, integrations, or other customer-defined categories.
- Group Name- Use this when you want to review analytics for a particular group instead of all groups that match the other selected filters.
- System Grouping- Identifies groups created and used by LCM Insights, such as the system-defined customization classifications.
The values are Custom, Customization, and False Positive.
- Complexity- Use this to focus on groups that may require more or less effort to analyze, maintain, or test.
Few PeopleSoft-delivered values are High, Low, and Medium. You cannot add or modify these values.
- Priority- Use this to focus on groups that are more important for maintenance planning, testing, ownership review, or update analysis.
You can see values from 1 to 5, which are PeopleSoft-delivered values. The default value is 3, and users cannot add or modify the delivered priority values.
- Owner- Use this to review groups assigned to a specific owner, role, or responsibility area.
PeopleSoft-delivered values include Functional Analyst, Line of Business Owner, Development Lead, and Test Lead.
Note:
The group category, group type, and owner (user role) fields are defined on the Manage Group Settings page. You can use the PeopleSoft-delivered categories types, and roles or create your own values.For details, see Using Manage Group Settings Page
Customization Ownership and Responsibility
Use the Customization Ownership and Responsibility to review ownership and category-based analytics for customization groups. The page helps you identify the owners responsible for customization groups and the functional categories associated with those groups.
This example illustrates the fields and controls on the Customization Ownership and Responsibility.
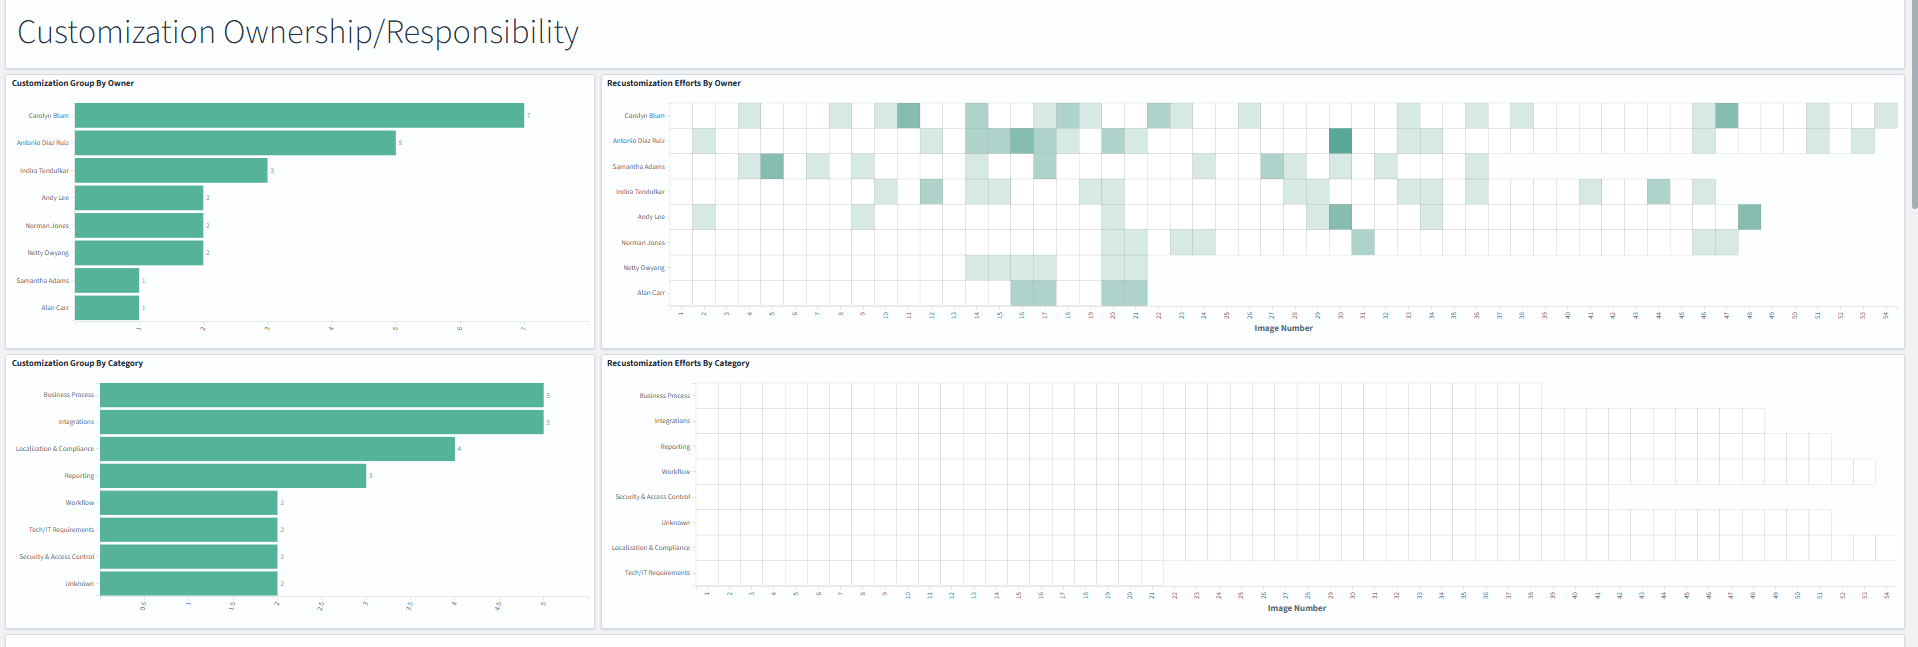
The available segments are:
- Customization Group By Owner- you can see how ownership is distributed across the team.
- Recustomization Efforts By Owner- you can review maintenance impact by owner across Image numbers and see which owners are most impacted and where follow-up may be needed.
- Customization Group By Category- you can see how customizations are organized by high-level functional areas.
- Recustomization Efforts By Category- you can review maintenance impact by category across Image numbers and you can see which areas need the most attention during maintenance planning.
Impact Projection
Use Impact Projection to review projected maintenance impact for customization groups. It displays impact counts, recustomization effort, test coverage, and usage information to help you determine which customization groups may require additional review before applying PeopleSoft Image updates.
This example illustrates the fields and controls on the Impact Projection.
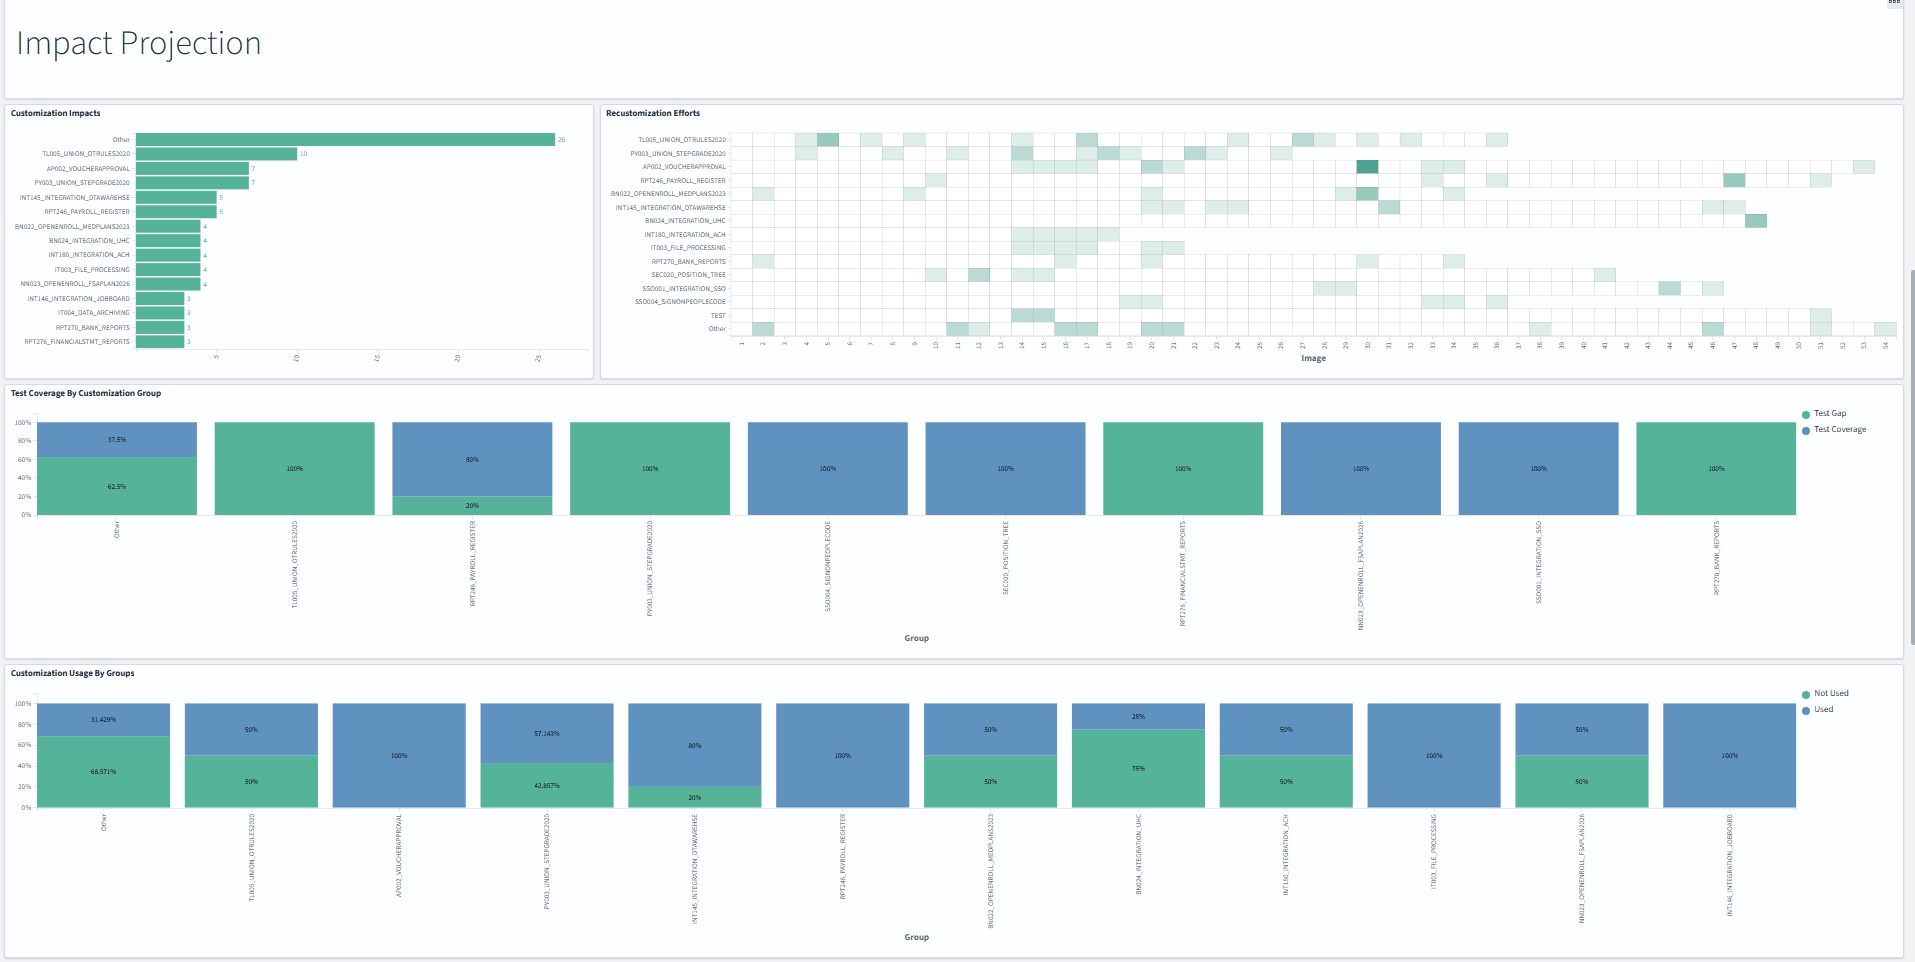
The available segments are:
- Customization Impacts- provides group-level impact counts.
- Recustomization Efforts- provides details on groups that may need the most rework across Images.
- Test Coverage by Customization Group- shows how much testing activity is associated with each customization group, based on the available Test Repository data. Instead of checking test coverage object by object, you can see whether a full group, such as Benefits, Payroll, or Integrations, has enough test activity before maintenance or upgrade work begins.
- Customization Usage by Groups- displays the usage percentage for each customization group. Each bar represents a Customization Group and is divided into Used and Not Used segments.
The Used segment indicates the percentage of objects in the group that are referenced in Usage Repository data after usage calculation.
The Not Used segment indicates the percentage of objects in the group that are not referenced in Usage Repository data after usage calculation.
Customization Trend
Use Customization Trend to review trend analytics for customization groups. The page displays group activity by type, category, and complexity, and provides additional analytics for testing, usage, and recustomization effort.
This example illustrates the fields and controls on the Customization Trend.
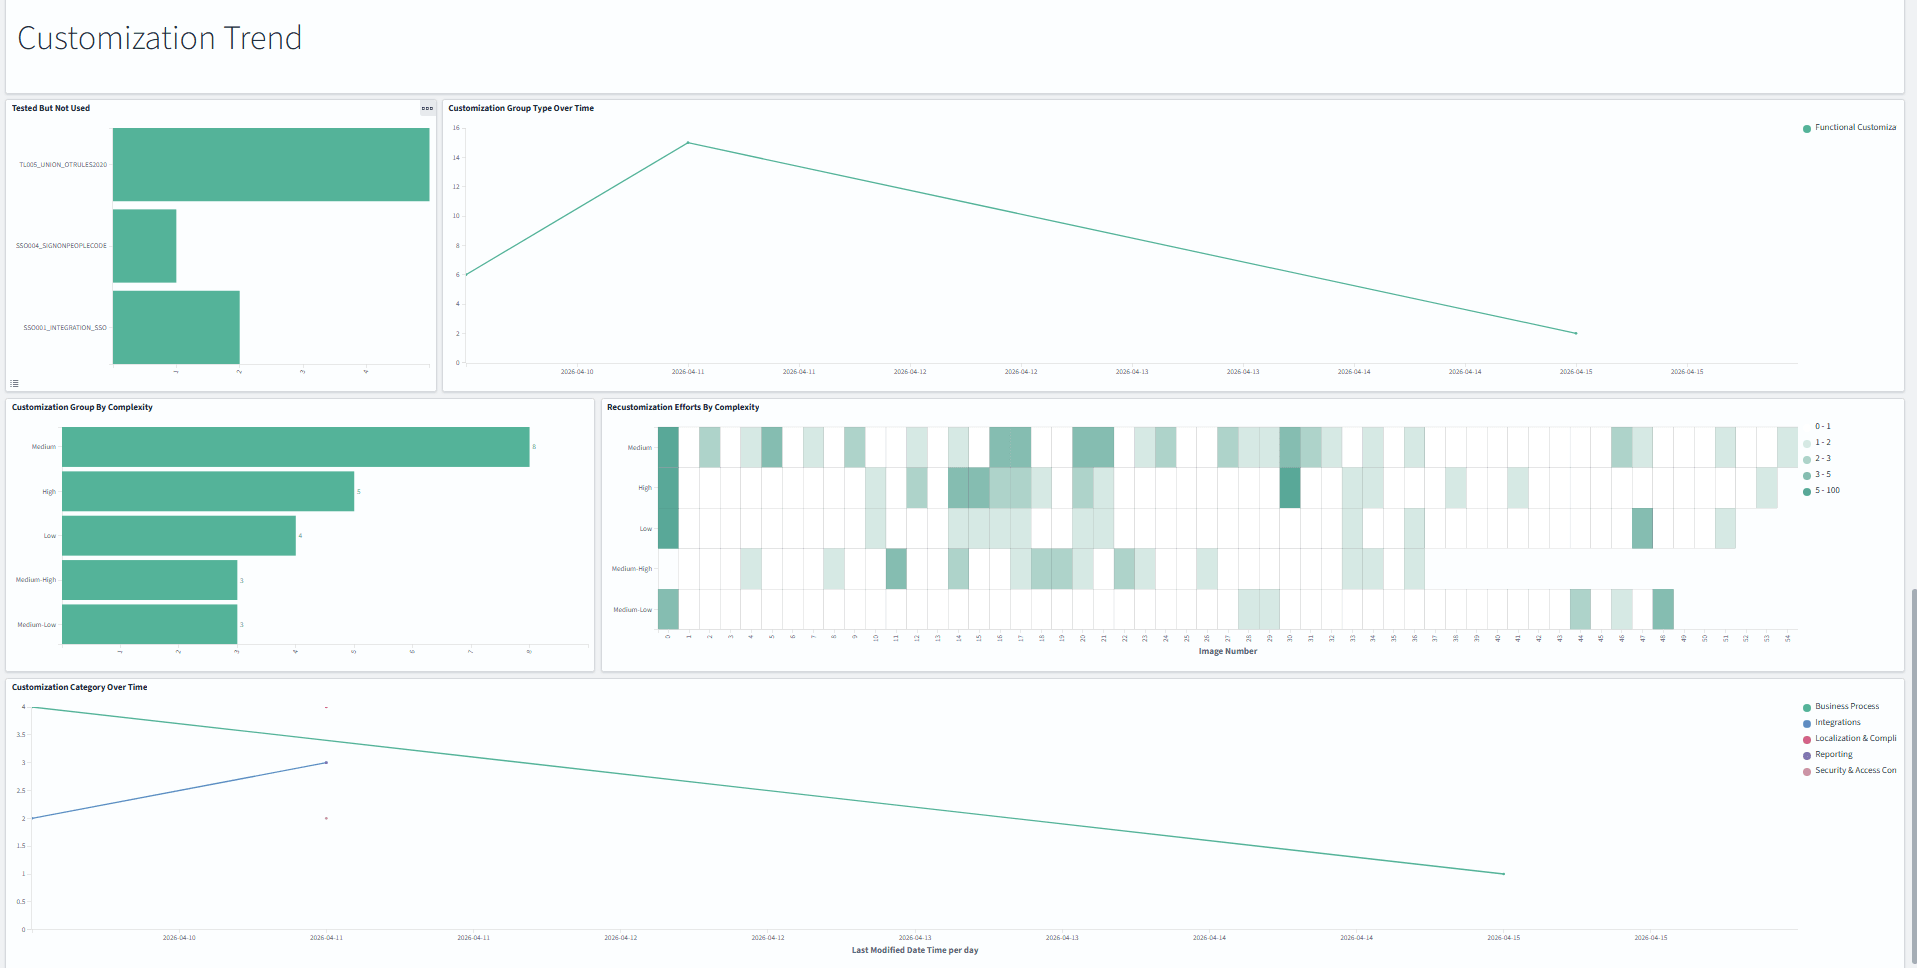
The available segments are:
- Tested But Not Used- displays customization groups that have test coverage but do not show usage activity. Use this to identify groups that may require usage validation. A group may appear in this chart if its objects are covered by tests but are not referenced in usage data.
- Customization Group Type Over Time- displays customization group counts by type across the selected date range. Use this to review how group types, such as Functional Customization, change over time.
- Recustomization Efforts By Complexity- Displays the number of customization groups assigned to each complexity level. Use this to understand whether the customization inventory is concentrated in low, medium, or high complexity groups.
Complexity is a group-level attribute that represents the relative complexity of a customization group. PeopleSoft delivers fixed values from 1 through 5, where 1 indicates low complexity and 5 indicates high complexity. The default value is 3. Users cannot add or modify the delivered complexity values.
- Customization Category Over Time- Displays customization group counts by category across the selected date range. Use this to identify functional areas where customization activity is increasing or decreasing.
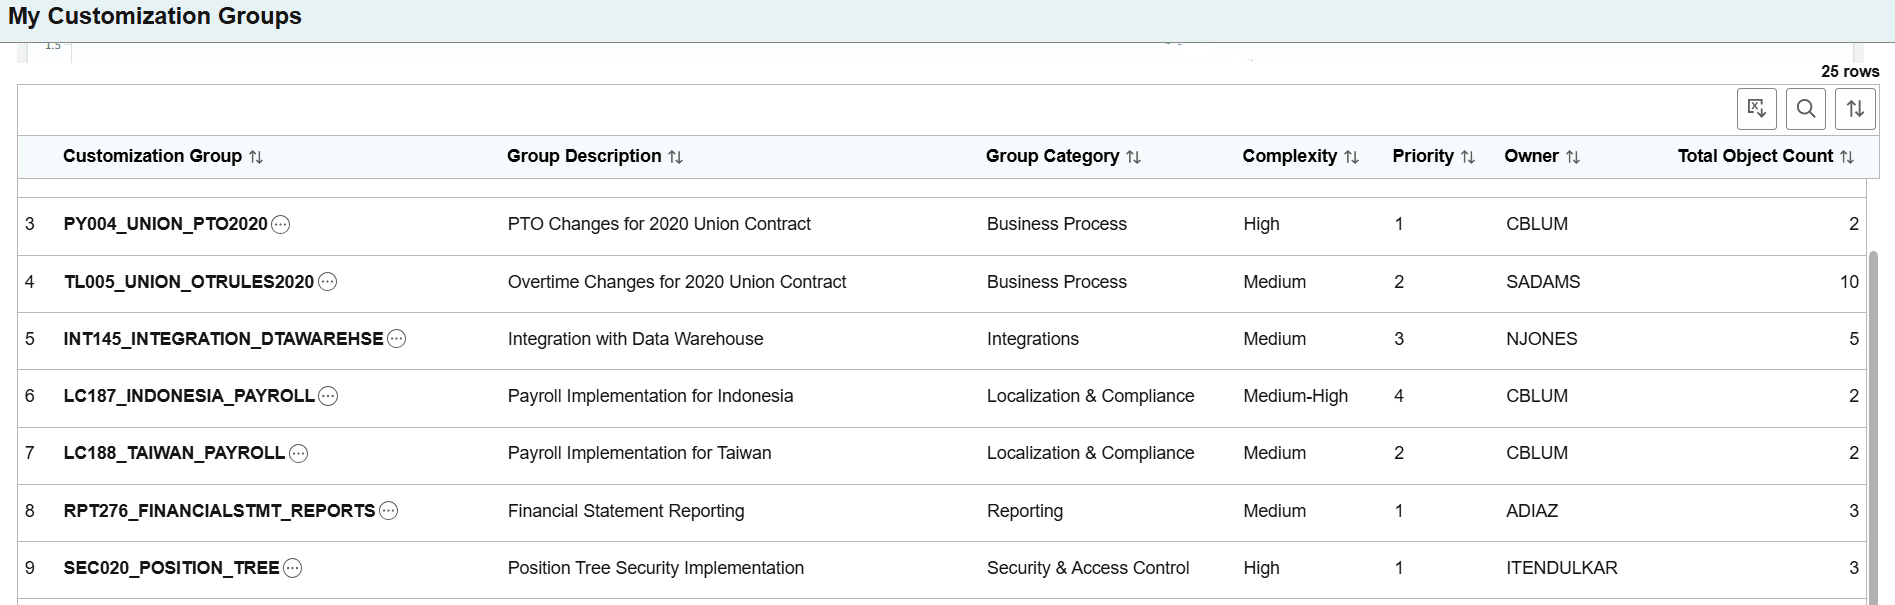
List of Customization
This grid displays the list of customizations created.
To create customizations, see Using Manage Groups Page and Using My Customized Objects Page