Including Pivot Grid and Chart View on the Application Page
To include the Pivot Grid and Chart view on the application page:
-
Access the Pivot Grid Wizard by selecting Reporting Tools, Pivot Grid, Pivot Grid Wizard.
-
In the Pivot Grid Display page - Step 5, click the Configure Pivot Grid Views link to access the Pivot Grid View page and create an additional Pivot Grid and Chart view for the Pivot Grid model. Alternatively, access the Specify Data Model Options page - Step 4 and change the default view of the Pivot Grid model to Pivot Grid and Chart.
For detailed steps to configure the pivot grid model through pivot grid wizard see, Specifying Data Model Options
Also see, Viewing Pivot Grid Displays.
-
In Application Developer, open the application page for job opening HR_OPEN_JO_FLU.
Note:
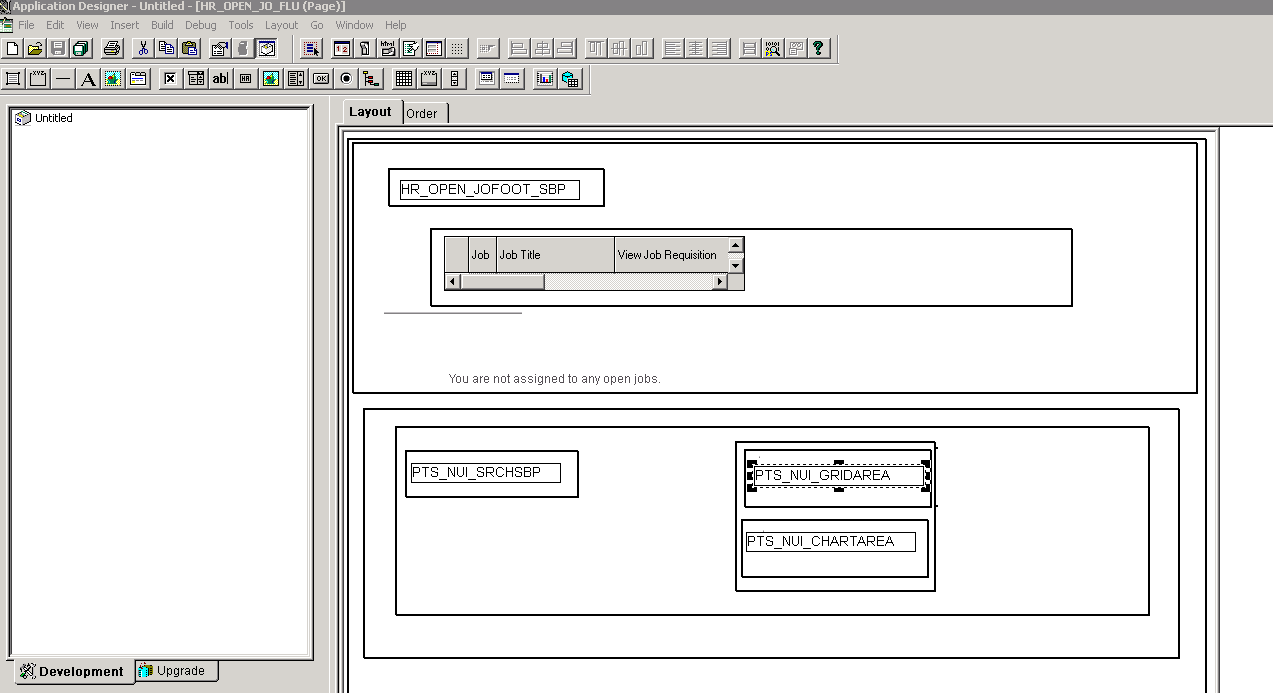
The application page HR_OPEN_JO_FLU already includes the system search subpage PTS_NUI_SRCHSBP and chart area PTS_NUI_CHARTAREA.
-
Insert the grid area PTS_NUI_GRIDAREA next to the chart area PTS_NUI_CHARTAREA.
-
Insert the horizontal rule set to level 0 before PTS_NUI_GRIDAREA and PTS_NUI_CHARTAREA.
Note:
You can apply the layout for the grid and chart areas horizontally using the style ps_box_horizontal for the group box surrounding them. Otherwise, you can apply the layout for the areas vertically by using the style ps_box_vertical for the group box surrounding them.
This example shows the application page for job opening HR_OPEN_JO_FLU, including the system search subpage PTS_NUI_SRCHSBP, chart area PTS_NUI_CHARTAREA, and grid area PTS_NUI_GRIDAREA. This example also includes a horizontal layout that uses the ps_box_horizontal style around the grid and chart areas.
-
Return to the application fluid page Job Openings.
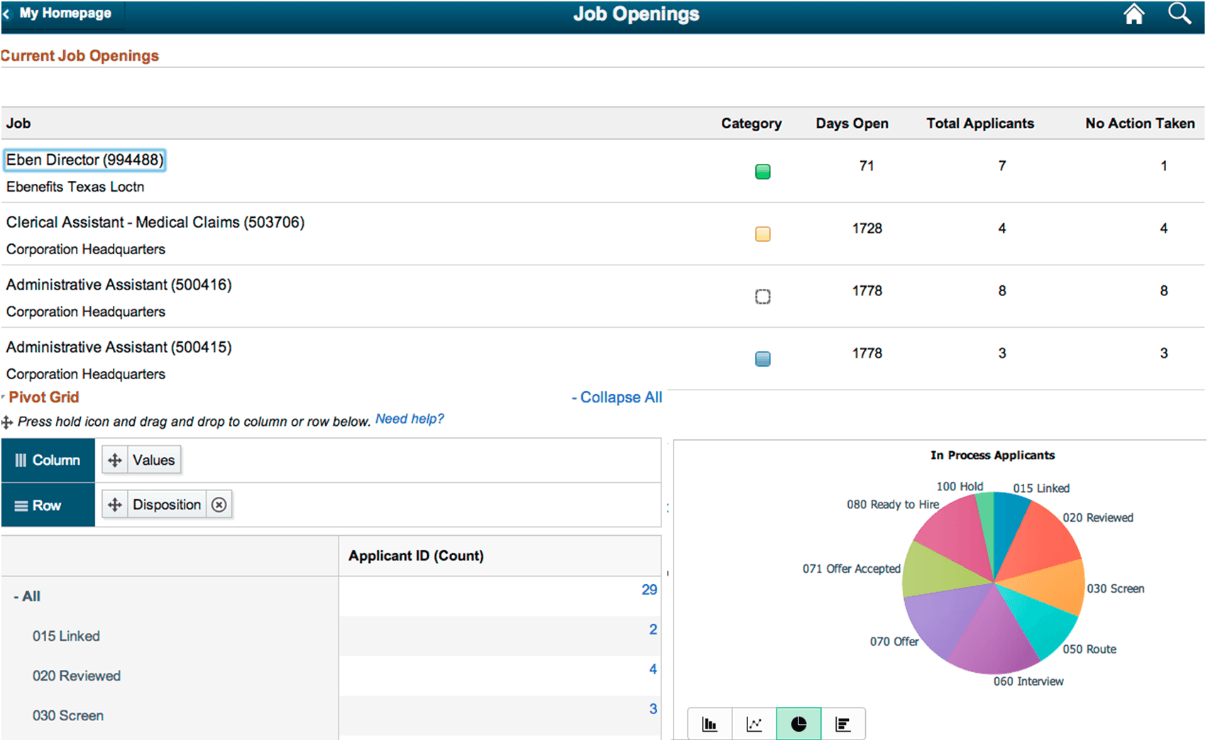
This example shows the rendered application fluid page Job Openings. The application page includes a chart, search options, and a grid. The grid and chart areas are next to each other horizontally.
Note:
You can include the facets and filters to the previous view. If you include the facets subpage, you can drag and drop between the facets and the grid as in the classic Pivot Grid Viewer. The drag-and-drop on the grid reflects the layout in the chart as well because the default view of the Pivot Grid model is Pivot Grid and Chart. Clicking the data point in the grid or chart displays the Detail View in a modal window by default. In a grid and chart view, the system cannot display the results grid on the face of the viewer because of space constraints.