Monitor Jobs
This section covers how to track and search job runs in your AI Data Platform Workbench.
About Jobs Runs
You can monitor the status of previous job runs, job runs in progress, or job runs that have been interrupted from the Job Runs page.
You can find a history of job runs in Job Runs tab of your job.

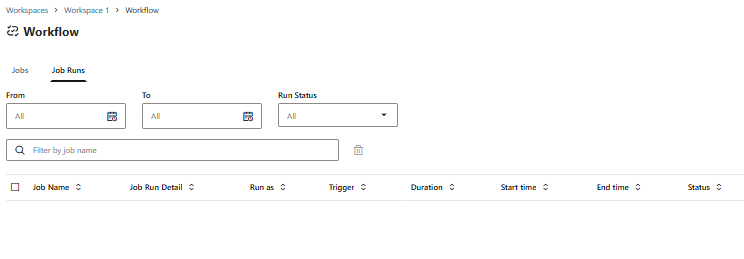
All jobs that have been run on your AI Data Platform Workbench are listed in the Job Runs page. The job run information is split into columns tracking different aspects of each job run. You can sort those columns in ascending or descending order by clicking the column header. You can filter the job runs displayed by using the dropdown menus, using the Search bar to filter by name, or combining multiple filter options.
| Column name | Description |
|---|---|
| Job Name | Name of the job |
| Job Run Detail | Click View to see the details page of the job |
| Run as | User or role that triggered the run |
| Trigger | Trigger type. Either Manual or Scheduled |
| Duration | Length of time taken to run the job |
| Start time | Start time |
| End time | End time |
| Status | Current job status |
The Status displays the current state of a job, using one of the values from the following list.
| Status | Description |
|---|---|
| Success | Job run was successful |
| Failed | Job run failed |
| Canceled | Job run was canceled |
| Skipped | Job run was canceled because a previous run of the same job was already active |
| Timed Out | Job run exceeded the configured time limit and was stopped |
View All Workflow Job Runs
You can see the recent history of your run workflow jobs from the Job Runs page.
- On the Home page, click Workflows.
- Click Job Runs.
- Optional: Filter the results by selecting date ranges, run status, job name or any combination of filters to find the workflow job runs you need.
View a Job's Run History
You can see records of all previous runs for a job and filter the results for greater detail.
- On the Home page, click Workflow.
- Click the job you want to view the run history for.
- Click the Runs tab.
- Optional: Filter the results by selecting date ranges or run status from the dropdowns.
Monitor a Specific Job Run
You can track the status and history of a specific job run from the Job Runs page.
- From the Job Runs page, click on View Job Run Detail for the job run you want to inspect.
- Click the Details tab to review run-level metadata such as job parameters, compute configuration, schedule, and start/end time.
- Use the buttons at the bottom of the Details page to see more specific information about the job run.
- Click View Details to inspect compute configurations, like driver and worker shape.
- Click Spark UI to inspect Spark stages, tasks, and resource usage for the run.
- Click Logs to view driver and worker logs and review errors, warnings, and other runtime messages.
- Click Metrics to monitor additional metrics related to compute, like CPU and memory usage.