Add Measures and Attributes to a Semantic Model

This topic describes how to add measures and attributes to your semantic model.

Topics:

Edit Measures and Attributes

Use the table editor to add, edit, and delete measures and attributes in your semantic model.

  1. In Data Modeler, lock the model for editing.
  2. Click the fact table or dimension table that contains the measure or attribute that you want to edit.
  3. To edit all the columns directly in the table editor, select Edit All.

    To edit, copy, or delete a selection of columns at the same time, Shift + click or Ctrl + click the rows you want.

  4. In the table editor, right-click a column and optionally click Copy or Delete as appropriate.
  5. In the table editor, click the column that you want to edit or click Add Column.
  6. Change settings on the Overview tab as needed.
    • Edit the display name and description.
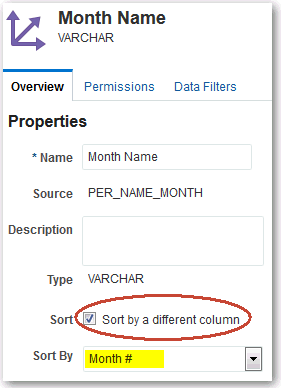
    • Change the sort order.

      By default, columns are sorted based on the data in the column and reports display data in this order. To sort a column based on the data in another column, select Sort by a different column and select the Sort By value you prefer. For example, instead of sorting a Month Name attribute alphabetically, you could sort by month number, such as 1 (January), 2 (February), 3 (March), and so on.

  7. Change settings for calculated measures or derived attributes.
  8. Optional: From the Permissions tab, modify object permissions.
  9. Optional: From the Data Filters tab, define data filters that provide row-level filtering for semantic model objects. See Secure Access to Data.
  10. Optional: From the Levels tab for columns in a fact table, create a level-based measure. See Set Aggregation Levels for Measures.
  11. Click Done to return to the table editor.

Specify Aggregation for Measures in Fact Tables

You can specify aggregation for a measure in a fact table. For example, you can set the aggregation rule for a Revenue column to Sum.

  1. In Data Modeler, lock the model for editing.
  2. In the Fact Tables area, click the fact table for which you want to create measures.
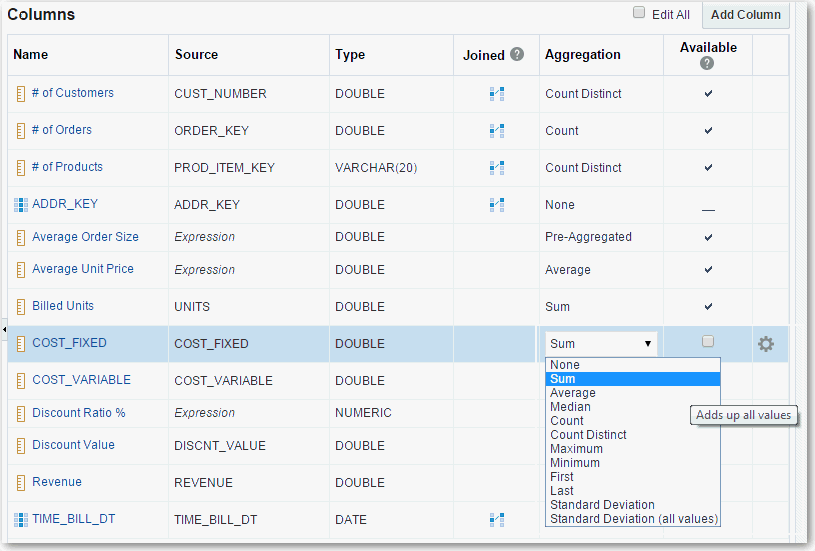
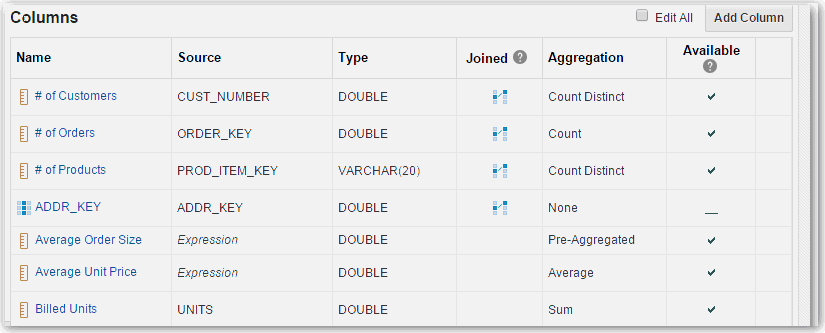
  3. In the Columns list, change the aggregation rule for the appropriate columns to specify that they're measures.

    To apply the same aggregation rule to multiple columns, Shift + click or Ctrl + click the appropriate columns.

    Aggregation options include:

    None: No aggregation.

    Sum: Calculates the sum by adding up all values.

    Average: Calculates the mean value.

    Median: Calculates the middle value.

    Count: Calculates the number of rows that aren't null.

    Count Distinct: Calculates the number of rows that aren't null. Each distinct occurrence of a row is counted only once.

    Maximum: Calculates the highest numeric value.

    Minimum: Calculates the lowest numeric value.

    First: Selects the first occurrence of the item.

    Last: Selects the last occurrence of the item.

    Standard Deviation: Calculates the standard deviation to show the level of variation from the average.

    Standard Deviation (all values): Calculates the standard deviation using the formula for population variance and standard deviation.

    Tip:

    Some calculated measures are Pre-Aggregated. These measures have calculations involving measures that already have an aggregation applied. To edit a calculation that contains pre-aggregated measures, click the column name.

    For most measures, the same aggregation rule applies for each dimension but for some measures you’ll want to specify one aggregation rule for a given dimension and specify other rules to apply to other dimensions.

    Time dimensions are most likely to require different aggregation. For example, Headcount (calculated measure) typically aggregates as SUM across Organization and Geography dimensions but SUM does not apply for a Time dimension. Aggregation for the Time dimension should be LAST, so you can show Headcount on the last week or day of the year.

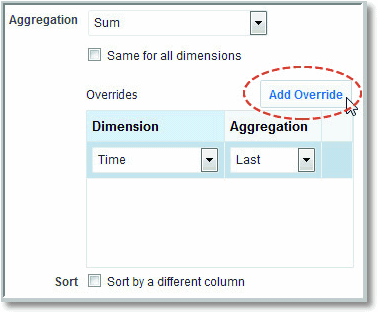
  4. To override the aggregation for specific dimensions:
    1. Click the name of the measure column.
    2. Deselect Same for all dimensions.
    3. Click Add Override.
    4. Select the dimension you want to aggregate differently, for example Time.
    5. Select an aggregation rule for the dimension.
    6. If required, override aggregation for another dimension.
    7. Click Done.
    When dimension-specific aggregation rules are defined for a measure, you see an asterisk * next to the aggregation rule in the Columns table. For example, Sum*.
  5. By default, all the columns in the fact table are displayed in reports. Deselect the Available box for any columns that you don’t want to display. You can use Shift + click or Ctrl + click to select multiple rows.
  6. Click Cancel to cancel any of your changes.
  7. Click Done to return to the table editor.

Create Calculated Measures

If a fact table does not include all the measures that you need, then you can create calculated measures. For example, you can create a calculated measure called Average Order Size using the formula Revenue/Number of Orders.

  1. In Data Modeler, lock the model for editing.
  2. In the Fact Tables area, click the fact table for which you want to create measures.
  3. In the Columns area, click Add Column.
  4. In the New Column editor, enter a name and description for the column.

    Then, enter an expression directly in the Expression box, or click Full Editor to display the Expression editor.

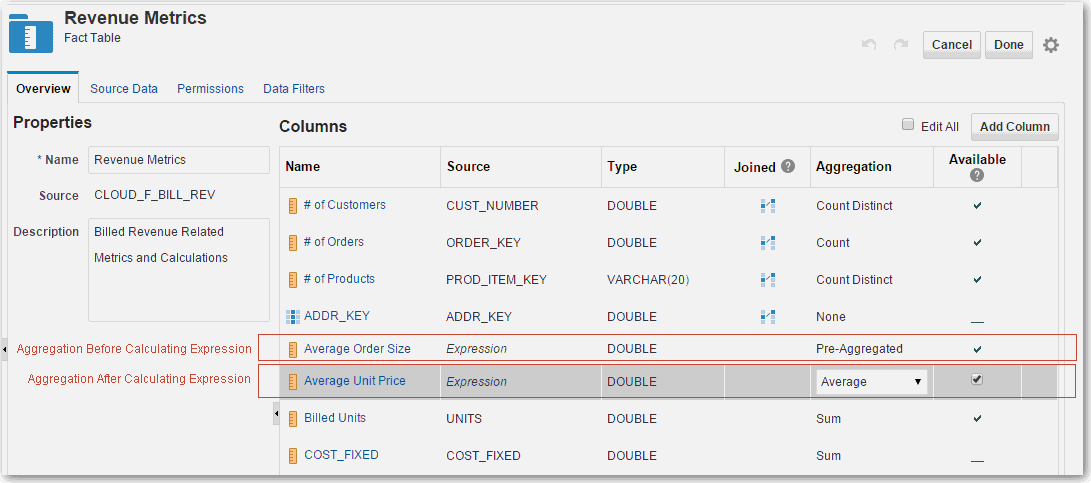
  5. Expressions can contain measures that are already aggregated, as well as measures with no aggregation applied. Do one of the following:
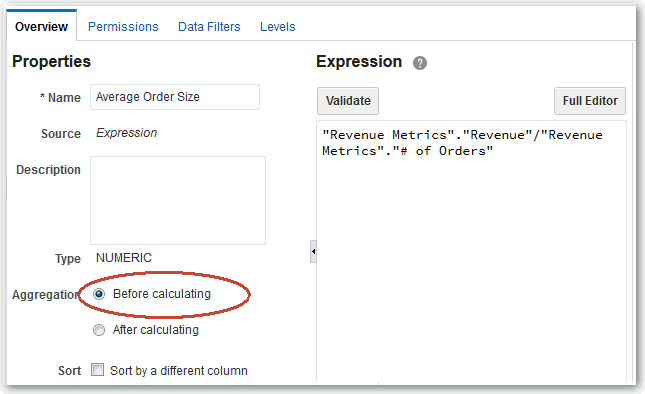
    • Set Aggregation to Before Calculating, if your expression includes measures that are already aggregated or aggregation is not required.

    • Set Aggregation to After Calculating and select an aggregation rule, such as Sum, Average, Count, to apply aggregation after calculating the expression.

  6. Click Done to return to the table editor.

About Creating Calculated Measures

Calculated measures, as the name suggests, are calculated from other measures. For example, you can create a measure that calculates Average Order Size using the formula Revenue/Number of Orders.

Calculations can contain measures that are already aggregated, as well as measures with no aggregation applied. For example:
  • Calculation includes aggregated measures: Sum(Revenue)/Sum(Orders)

  • Calculation includes measures with no aggregation applied: UnitPrice X Quantity

    If the measures in your calculation aren’t pre-aggregated, such as UnitPrice and Quantity, you may apply aggregation after the calculation. For example, Sum(UnitPrice X Quantity).

Check the measures in your calculations before choosing whether to apply aggregation Before Calculating or After Calculating your expression.

Calculations Include Measures Already Aggregated

Set Aggregation to Before calculating if the calculation contains pre-aggregated measures. For example: Sum(Revenue)/Sum(Orders).

Calculations Include Non Aggregated Measures

Optionally, you can apply aggregation after your calculation. Set Aggregation to After calculating and then select an aggregation rule from the list. For example, Sum, Average, Count and so on.

Don’t include expression columns in the calculation. If you include aggregated columns in the calculation, aggregation on the columns is ignored.

Description of data_mod57.gif follows
Description of the illustration data_mod57.gif

Create Derived Attributes

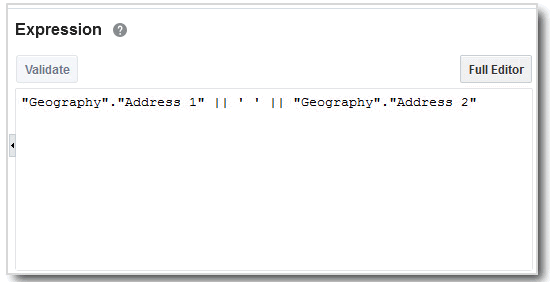
You can create custom or derived attributes for dimension tables that are based on an expression. For example, you can use an expression to concatenate multiple address columns into a single Full Address column.

  1. In Data Modeler, lock the model for editing.
  2. In the Dimension Tables area, click the dimension table for which you want to create derived attributes.
  3. In the Columns area, click Add Column.
  4. In the New Column editor, enter a name and description for the column. Then, enter an expression directly in the Expression box, or click Full Editor to display the Expression editor.

    You can use a variable in a column expression.

  5. Click Done to return to the table editor.

Create Expressions in the Expression Editor

You can use the Expression Editor to create constraints, aggregations, and other transformations on columns.

Topics:

About the Expression Editor

When modeling data, you can use the Expression Editor to create constraints, aggregations, and other transformations on columns. For example, you can use the Expression Editor to change the data type of a column from date to character. You can also use the Expression Editor to create expressions for data filters.

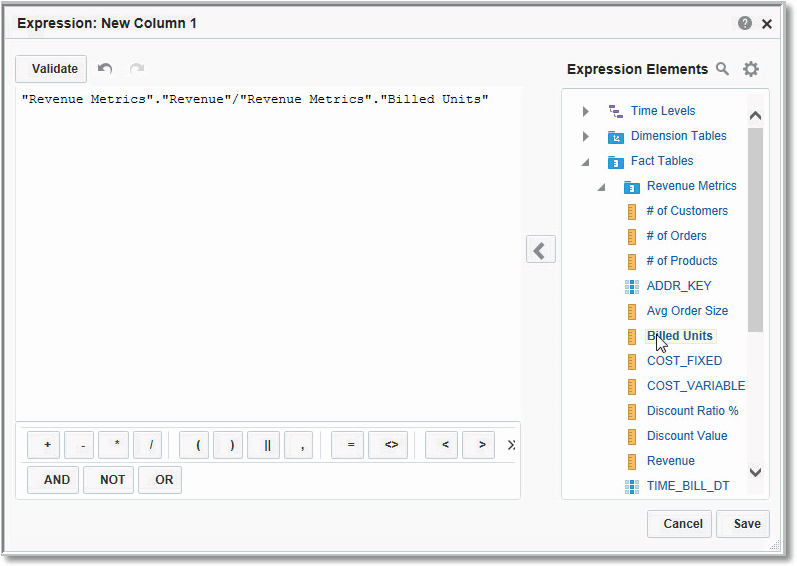
The Expression Editor contains the following sections:

  • The Expression box on the left-hand side enables you to edit the current expression.

  • The toolbar at the bottom contains commonly used expression operators, such as a plus sign, equals sign, or comma to separate items.

  • The Expression Elements section on the right-hand side provides building blocks that you can use in your expression. Examples of elements are tables, columns, functions, and types.

    The Expression Elements section only includes items that are relevant for your task. For example, if you open the Expression Editor to define a calculated measure, the Expression Elements section only includes the current fact table, any dimension tables joined to that table, plus any fact tables indirectly joined through a dimension table. Similarly, when you define a derived attribute, you see the current dimension table, any fact tables joined to that table, and any dimension table joined to those fact tables.

    Another example is that time hierarchies are only included if the Time fact table is joined to the current table.
    See Expression Editor Reference.

Create an Expression

You can use the Expression Editor to create constraints, aggregations, and other transformations on columns.

  1. Add or edit a column from the Table editor.
  2. Enter an expression in the Expression box and click Done. Or, click Full Editor to launch the Expression Editor.
  3. Use the Expression Elements menus to locate the building blocks you want to use to create your expression.

    Drag and drop an element to add it to your expression. You can also double-click an element to insert it, or you can select the element and click the arrow icon.

    When you add a function, brackets indicate text that needs to be replaced. Select the text, then type, or use the Expression Elements menus to add the appropriate element.

    See Expression Editor Reference.

  4. Click Filter and then enter text in the search box to filter the available elements. Remove the text to revert to the full list of elements.
  5. Click Actions to show or hide menus under Expression Elements, or to expand or collapse all menus.
  6. Click an item on the toolbar to insert an operator.
  7. Click Undo or Redo as needed when building your expression.
  8. Click Validate to check your work.
  9. Click Save when you’re finished.

Copy Measures and Attributes

You can copy measures and attributes in your semantic model.

  • From the Data Model menu in the left pane, right-click the column that you want to copy and select Copy.
    To copy multiple columns, Shift + click or Ctrl + click all the rows that you want and right-click to select Copy.
  • From the Data Model menu in the left pane, click Column Actions for the column that you want to copy and select Copy.

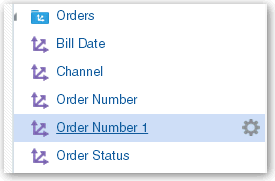
The copy is displayed with a number added to the name.