Format Data with Existing Conditional Format Rules

To highlight important events in your data, you can activate or deactivate existing conditional formatting rules. For example, you might want to show when revenues meet high, medium, and low thresholds.
  1. On the Home page, hover over a workbook, click Actions (Actions menu ellipsis icon), then select Open.
  2. Click Visualize.
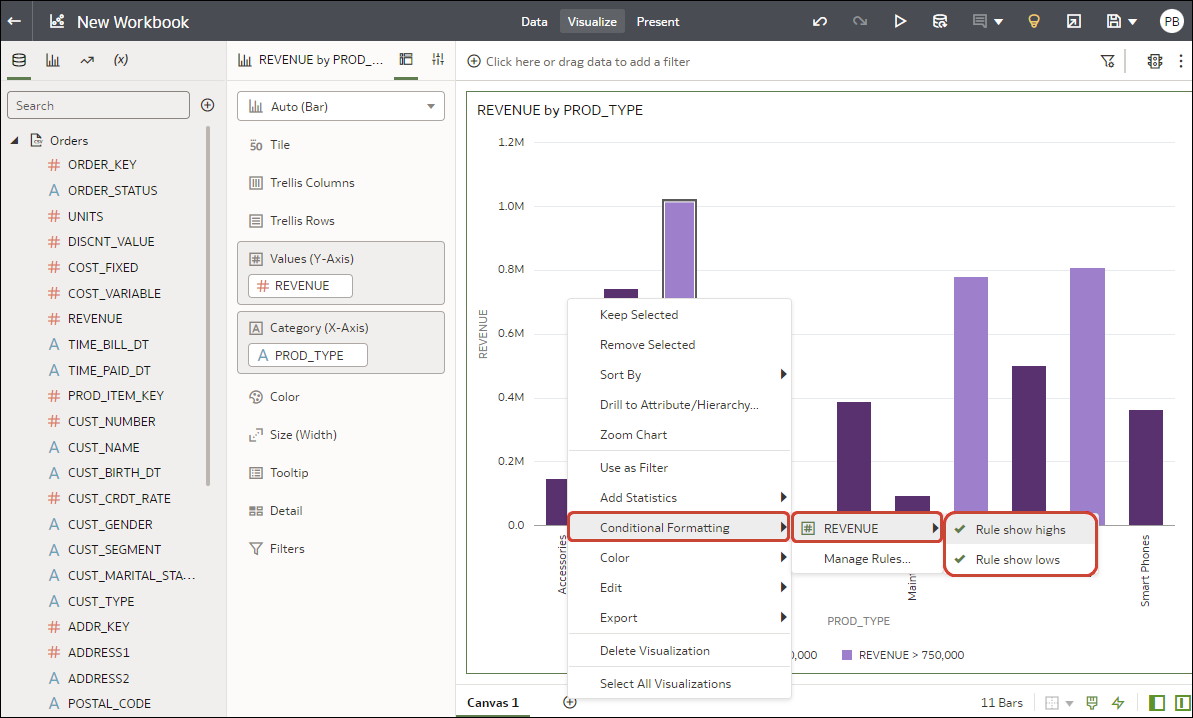
  3. From the visualization editor, hover over a visualization, right-click, then select Conditional Formatting to show measures with rules available.
    If a measure has no rules available, click Manage Rules to display the Conditional Formatting dialog, where you can create rules.
  4. Click a measure (for example, REVENUE), to display rules available for measure.
    In this example, REVENUE has two rules available, 'Rule show highs' and 'Rule show lows'. Active rules have a check mark.

  5. Click on rules to activate or deactivate them.