About the Limit Values Settings for Filters
In Oracle Analytics, the selections you make for one filter can impact the values available to select from for other filters on your canvas. The impact depends on the filter's location and the Limit Values settings.
The Limit Values settings in a workbook operate based on filter location rather than filter scope. The filter location is where the filter is added in the workbook, whereas the filter scope is the range of data the filter acts on. Filters in higher locations normally limit filters in lower locations.
- Filter bar
- Dashboard filters visualizations
- Individual visualizations (for visualization filters)
For information about filter scopes, see Filter Scopes.
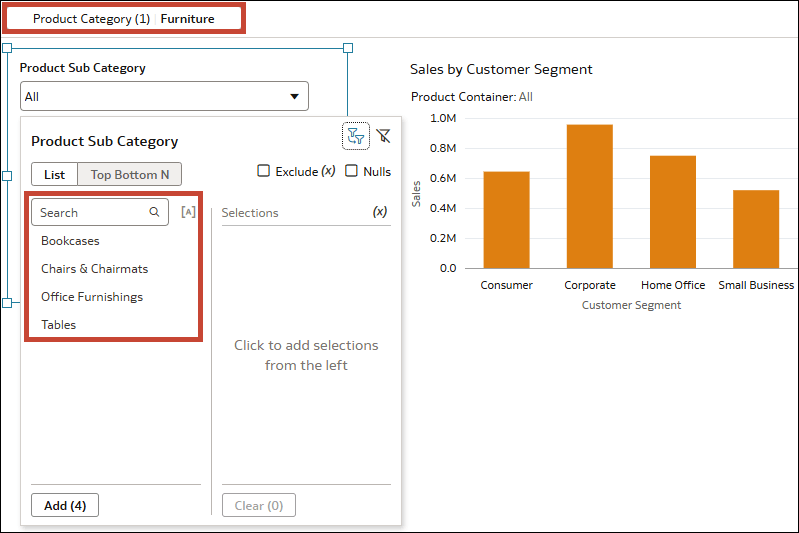
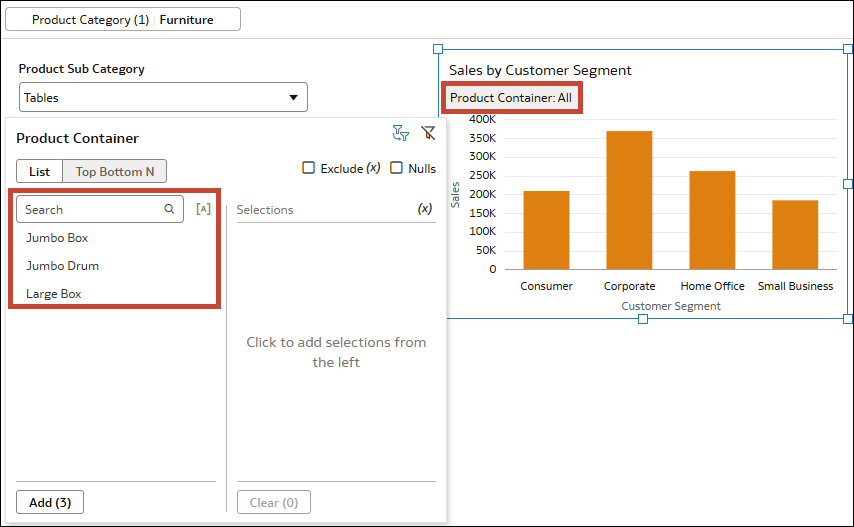
For example, you can filter a visualization that shows Sales by Customer Segment using filters in the three different filter locations. You add a filter in the filter bar using the column Product Category, a dashboard filter on your canvas with the column Product Sub Category as the filter control, and a visualization filter on the visualization itself using the column Product Container.
If you select Furniture in your Product Category filter, the values available to select from for Product Sub Category are limited to only those product subcategories that fall in the Furniture product category.
Description of the illustration filters_limit_values_example1.png
The values available to select from for Product Container are also limited to only those that fall in the Furniture product category.
If you then select Tables for Product Sub Category, the values for Product Container are further limited to only those used for that product subcategory.
Description of the illustration filters_limit_values_example2.png
Default Filter Behavior
- The selections you make for a filter limit the values of any other filters in lower locations.
- The selections you make for a filter also limit the values of any other filters in the same location, regardless of filter scope.
In the filter bar, this means that selections for canvas filters can limit workbook filter values. In a dashboard filter, the selections for one dashboard filter control can limit any other dashboard filter controls. If there's more than one visualization filter on a visualization, the selections for one can limit the others.
- If you add a visualization filter on a dashboard filters visualization, that filter limits the values for the dashboard filter controls.
Note:
Administrators can change this default behavior by configuring the system setting Default Limit Values By for Filters. See Default Limit Values By for Filter. Ask your administrator what this system setting is set to before you configure any limit values settings within your workbook.Limit Values Settings
- The Limit Values By property in the Filter Bar Menu applies to all items in the filter bar. See Specify Limit Values By for the Filter Bar.
- The Limit Values setting in the Filter dialog for individual workbook, canvas, and visualization filters applies to only that filter. See Specify Limit Values for Workbook and Canvas Filters and Specify Limit Values for Visualization Filters.
- The Limit Values By property for dashboard filters applies to only the selected dashboard filter control. See Specify Limit Values By for Dashboard Filters.
- The Filter This Viz By property for an individual visualization, including dashboard filters visualizations, lets you prevent filters from a higher location from affecting the filters in the visualization. See Specify Which Filters to Apply to a Visualization.
Configuring Limit Values settings isn't supported for Top Bottom N filters.