View Error Messages and the Message Payload in the Activity Stream of Failed Instances
You can view error messages and the message payload in the activity stream of failed integration instances on the Errors page. You can also download the activity stream logs and the payload of the failed section of an integration instance.
- In the navigation pane, click Observability, then Errors.
- Perform the following tasks:
Filter the Display of Error Message Details
- Click
Filter
 to filter the display of errors by the following:
- Last updated or creation time
- Project (begin entering a name to display a list from which to select)
- Integration
Begin typing an integration name. Do not use copy and paste. The filter is refreshed to display fields for the defined secondary business identifiers.
You can now begin typing the values of the business identifiers to narrow down the search. This input follows the same rules (for example, for exact matches and phrase matches) as described in Search for Primary and Secondary Business Identifier Values.
- Error type (all, recoverable, or nonrecoverable)
- Instance ID
- Error message
For example:
- Enter part of an error message, such as
unknown,unauthorized, orendpoint. - Enter an exact phrase match of an error message in double
quotes, such as
"Could not activate endpoint for
                                            endpointID"
- Enter part of an error message, such as
- Detailed error message
- Connection name
- Integration style (all, application, schedule, or event)
- Integration state (all, retained, or purged)
&filenameor"file tracking").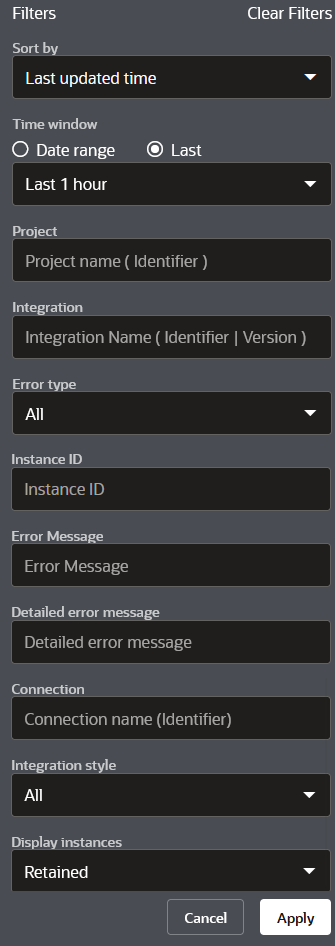
- Click Date Range in the Time Window section.
- Specify a custom time range with which to filter the search for errors with the From and To buttons. This functionality also exists on other monitoring pages such as the Instances page and Monitor Integrations page.
View Error Message and Payload Details on the Errors Page
Error message details can be displayed in two parts: a summarized error message for easy understanding and resolution and, if necessary, a more specific error message if more detailed troubleshooting is required. You can view error messages on the Errors page or by clicking on a business identifier to view the entire integration flow on the Instance Details page. You can also view the payload details in the activity stream of a failed instance.
- Hover over the row of the failed instance.
- Click View
 . The Activity Stream panel opens. The activity stream shows details
about the movement of the message through the integration, including where any
failures occurred. The date and time according to your user preferences are
displayed.
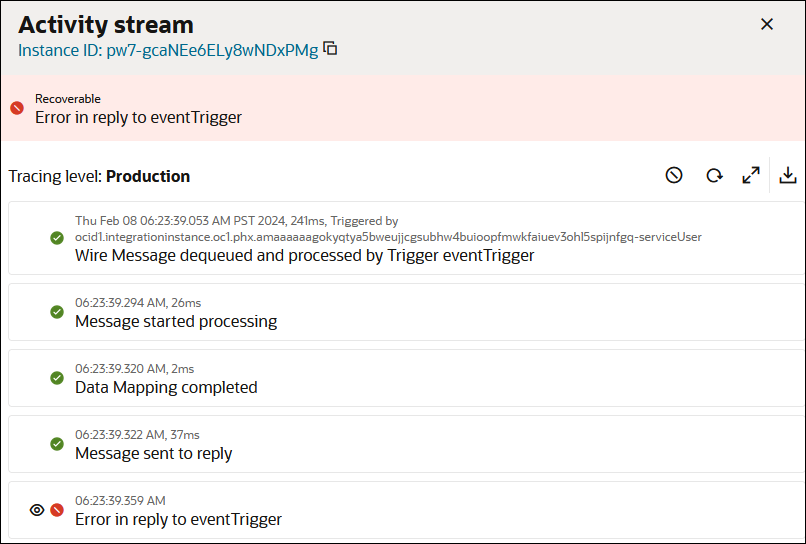
- Click Download Logs
 at the top of the activity stream to download the activity stream logs
for the entire instance. The Oracle Cloud identifier (OCID) value of your
service instance is also included in the logs.
- Scroll through, expand milestones, and click View
Payload
 to view the payload for the part of the integration flow that failed.
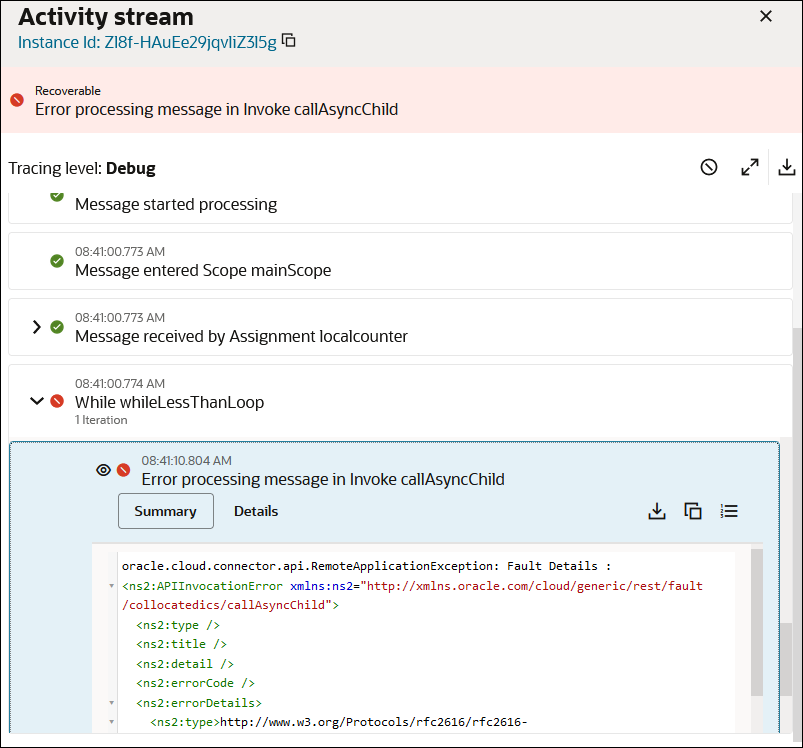
An option is provided in the activity stream for quickly showing all error content only. This option can be especially useful for instances in which a logic action such as a for-each loop or while loop with many iterations has failed. This option enables you to jump quickly to the iteration that failed instead of scrolling through each iteration of the loop to access the errors. Show errors in either of two ways:
- Click View Errors
 to view only the errors in the activity stream. This persists the selection of errors in
the activity stream across multiple instances until you deselect the
button. This button enables you to toggle between showing only errors
and showing all content in the activity stream.
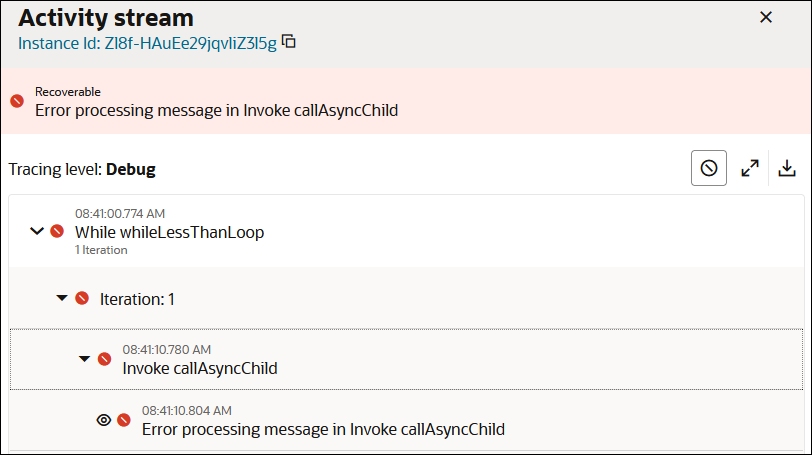
or
- Click the error in the activity stream banner to jump to
that specific error.
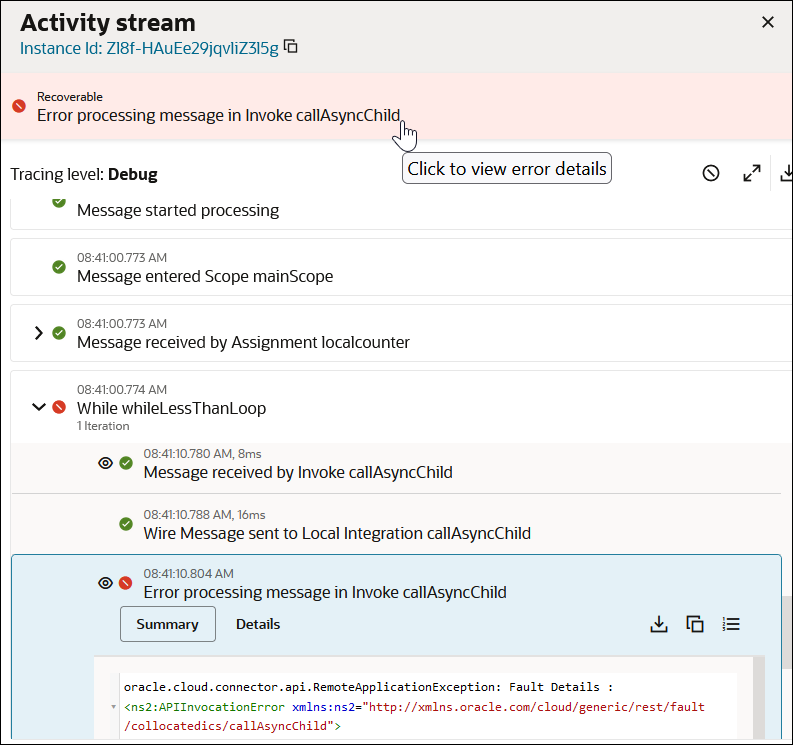
- Click View Errors
- Perform tasks within the failed part of the payload.
Element Description Download Payload 
Click to download this part of the payload to your desktop. Copy Payload 
Click to copy this part of the payload for pasting into a document. Toggle Line Numbers 
Click to show or hide line numbers in the payload. or
- Hover over the row of the failed instance.
- Click Expand
 to view a summarized version of the error message for easy
understanding and a detailed version that describes how to resolve the error.

View the Flow of the Failed Instance and Payload Errors in the Activity Stream on the Instance Details Page
You can view the flow of the failed instance to identify any trigger, actions, or invokes in error on the Instance Details page. You can also drill into those elements to view specific error messages and payload errors.
- Click a specific business identifier of an integration instance in
the Primary Identifier column.

The integration flow of the failed instance and Activity Stream panel are displayed.
- Scroll through the flow to find the trigger, action, or invoke in error.
- Click the element, then click Actions
 and select View Error.
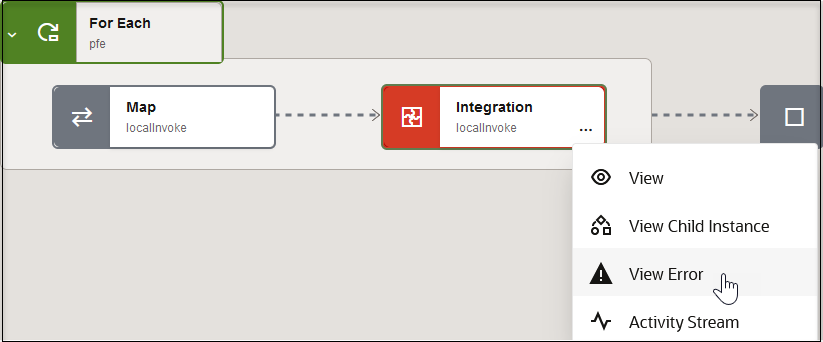
The Activity Stream panel opens to the specific section at which the error occurred. For this example, the error occurred in an integration action (parent integration calling a child integration) of a parallel for-each action. All five of the iterations of the parallel for-each are displayed for viewing in the activity stream.
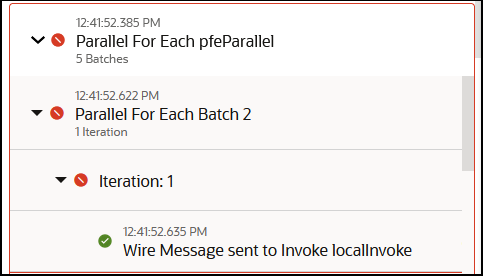
- Scroll through and view the errors.
- Click Activity Stream
 to close the activity stream. This link operates as a toggle for
closing or opening the activity stream.
- Click the failed trigger, action, or invoke again, then click
Actions
 and select Activity Stream.
This also opens the Activity Stream panel to the specific section at which the error occurred.
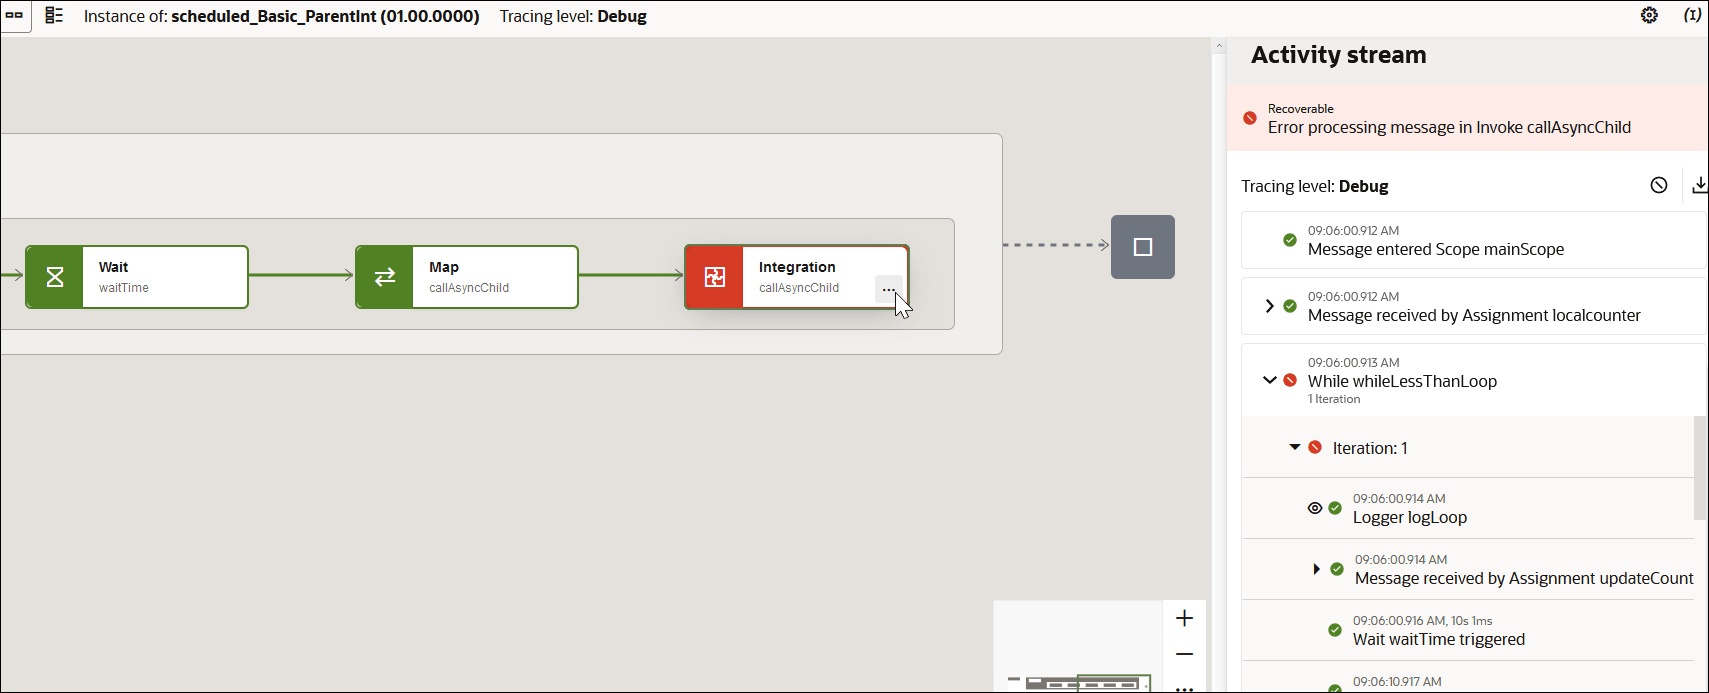
- Scroll through the payload and expand the sections in error to view specific details.
- Click View Payload
 to view the payload of the section in error.
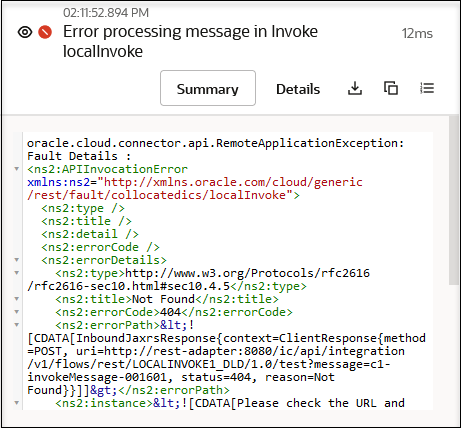
- Perform other tasks within this section.
Element Description Summary Click to view a summary of payload details. This action also highlights the section of the integration flow in error. Details Click to view more specific payload details. This action also highlights the section of the integration flow in error. Download Payload 
Click to download this part of the payload to your desktop. Copy Payload 
Click to copy this part of the payload for pasting into a document. Toggle Line Numbers 
Click to show or hide line numbers in the payload. - Click Activity Stream
 to close the activity stream.