Create a Property Graph from Existing Relational Tables

You can create a new PGQL property graph from existing relational tables.

Note:

The PG Objects graph type is desupported. It is recommended that you create a PGQL Property Graph.

It is also important to note that if the source tables for creating a PGQL Property Graph fulfills any one of the following conditions:

  • Contains composite vertex keys
  • Contains any one of the Datetime data types in the primary key

Then the property graph wizard will throw a warning when creating the graph. However, you can still create a PGQL property graph by ignoring the warning. But you cannot load the PGQL property graph into memory.

To create a PGQL property graph from existing relational tables:
  1. Navigate to the Graphs page.
  2. Select the Property Graph tab and click Create Graph.
    The property graph wizard opens displaying the Overview page.
  3. Enter the Graph Name
  4. Optionally enter the graph Description, Tags and click Next.
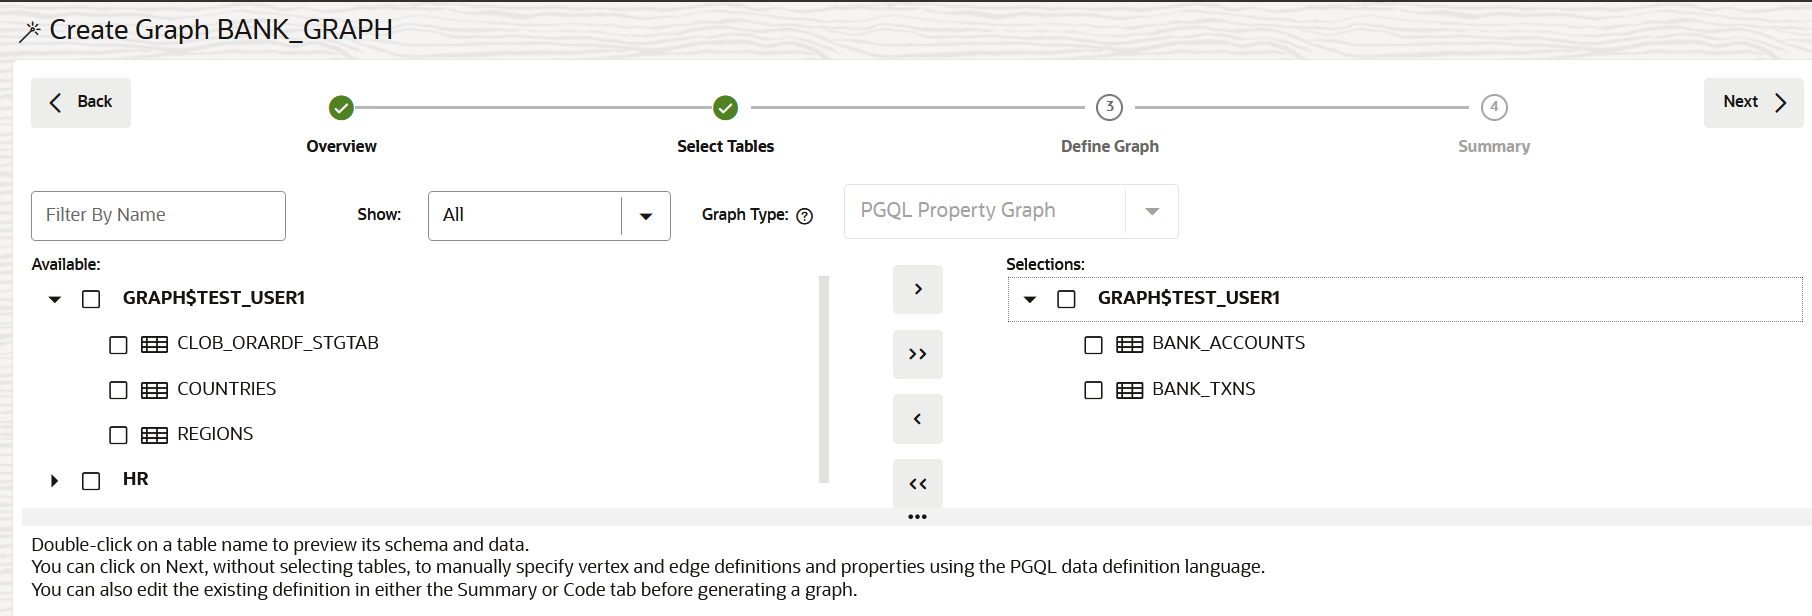
  5. Select the data tables that are required as input for the graph and move them to the Selections section on the right.

    Description of pg_workflow_select_tables.png follows
    Description of the illustration pg_workflow_select_tables.png

    The following table shows a few supported input types and the corresponding default mapping when transformed into graph properties:

    Oracle Database TypeFoot 1 Oracle PGX Type
    NUMBER The following implicit type conversion rules apply:
    • NUMBER => LONG (for key columns)
    • NUMBER => DOUBLE (for non-key columns)
    • NUMBER(m) with m <= 9 => INTEGER
    • NUMBER(m) with 9 < m <= 18 => LONG
    • NUMBER(m,n) => DOUBLE

    In the preceding entries, m is the variable for precision and n is the variable for scale.

    CHAR or NCHAR STRING
    VARCHAR, VARCHAR2, or NVARCHAR2 STRING
    BINARY_FLOAT FLOAT
    BINARY_DOUBLE DOUBLE
    FLOAT The following implicit type conversion rules apply:
    • FLOAT(m) with m <= 23 => FLOAT
    • FLOAT(m) with 23 < m => DOUBLE

    In the preceding entries, m is the variable for precision.

    DATE or TIMESTAMP TIMESTAMP
    TIMESTAMP WITH LOCAL TIME ZONE TIMESTAMP
    TIMESTAMP WITH TIME ZONE TIMESTAMP WITH TIME ZONE

    Footnote 1 Data types for a PGQL Property Graph share a one-to-one mapping with Oracle Database data types.

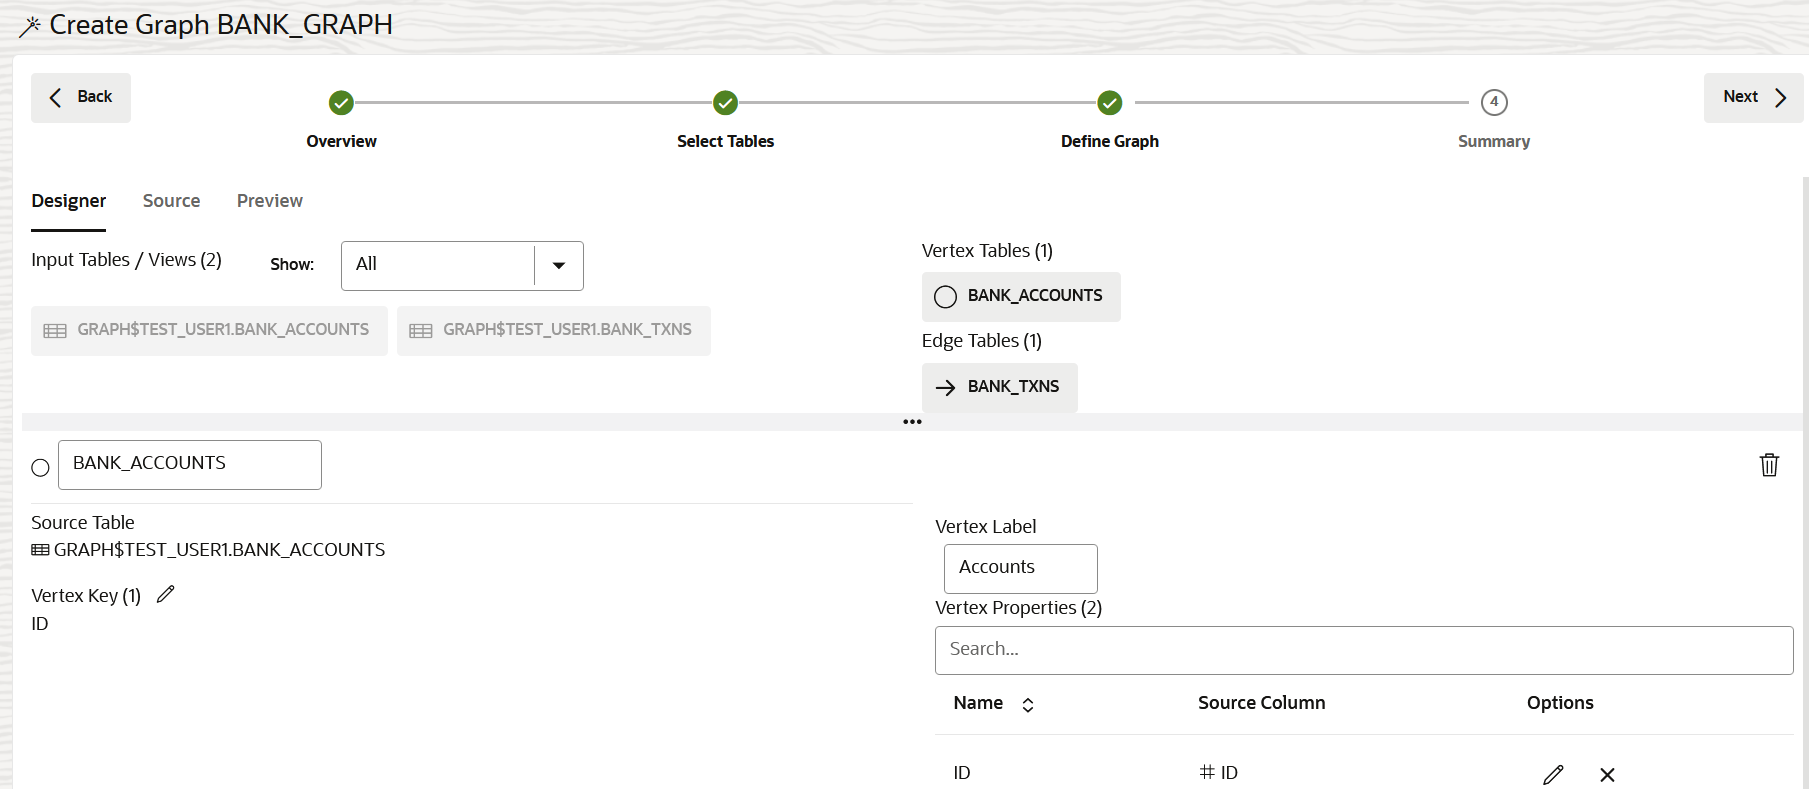
  6. Click Next to view the suggested graph definition.
    You can modify the graph definition if required.

    Note:

    Verify if the vertex and edge table keys are defined for the graph. These keys are generated automatically by the property graph wizard. In case the wizard is unable to generate the vertex and edge table keys, then you must manually specify these keys. Otherwise, the wizard will not proceed to the next step of graph creation.

    See Specify Vertex and Edge Table Keys for more information on how to add or edit the vertex and edge table keys.

  7. Click Next to view the graph summary.
    Graph Studio evaluates the graph definition and displays a summary of the graph if the validation is successful.

    Otherwise it may report errors, warnings, or both:

    Description of errors_warnings.png follows
    Description of the illustration errors_warnings.png
    The errors and warnings may vary depending on the graph type. Also, note the following:
    • Errors: Errors appear at the beginning in the Errors and Warnings slider. You need to resolve the errors in order to create a graph.
    • Warnings: Warnings are reported following the errors. Graph Studio allows you to create a graph despite the warnings, but the graph cannot be loaded into memory. See Warnings During PGQL Property Graph Creation for more information on the warnings details when creating a PGQL property graph.

    You can choose one of the following actions provided on the error or warning message:

    • Remove Column: Removes the column from the vertex or edge table and the graph definition is updated and re-validated.
    • Remove Table: Removes the vertex or edge table and the graph definition is updated and re-validated.
    • Ignore: Dismisses the error or warning message. Ignoring a warning allows you to continue to the next step of creating a graph. However, ignoring an error does not allow you to proceed with the graph creation. If all the reported errors and warnings are ignored, the Errors and Warnings slider is automatically closed.
    • Remove All: Removes all the tables and columns that cause errors or warnings and the graph definition is updated and re-validated.
    • Ignore All: Closes the Errors and Warnings slider.
  8. Click Create Graph.

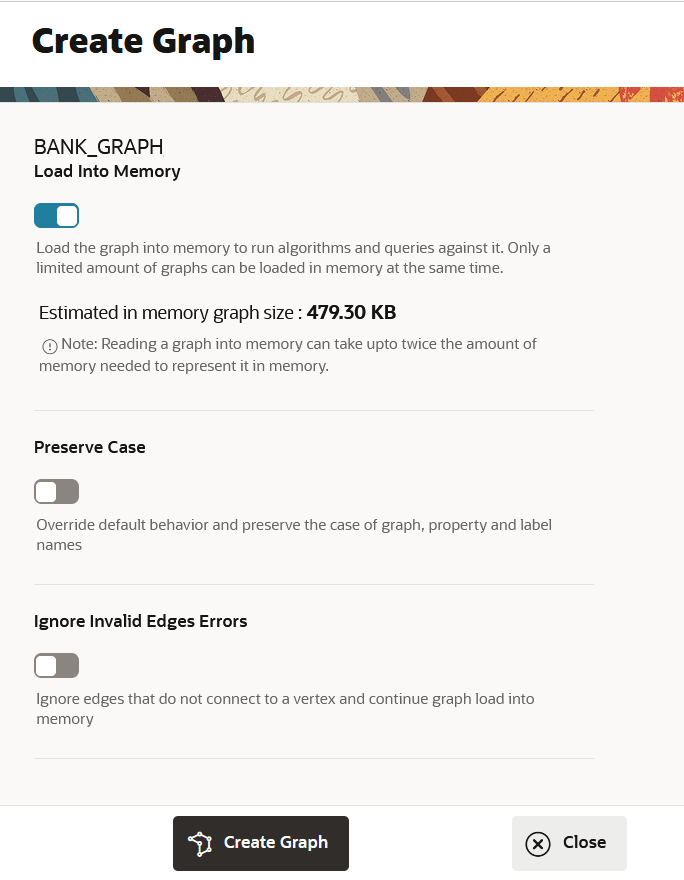
    This opens the Create Graph slider as shown:

    Description of create_graph.png follows
    Description of the illustration create_graph.png
  9. Optionally, switch on or off the Load Into Memory toggle.
    By default, the Load Into Memory toggle is switched on for successfully validated graph definitions. However, it will be disabled if you had ignored any warnings reported on the graph definition.

    The Estimated in memory graph size is also computed and displayed in the slider. Also, note the following with respect to the status of the compute environment:

    • Detached:
      • If the estimated graph size is less than the graph server (PGX) memory that is configured in the compute environment settings, then this new estimated value will be automatically saved as the default memory preference for the graph server (PGX). In this case, the slider will additionally display the following message:

        This value will be saved as memory preference when compute environment is started.

      • If the estimated graph size is greater than the maximum memory allowed to be allocated to the graph server (PGX) in the compute environment settings, then the following warning will be displayed in the slider:

        A graph of this size will likely result in OutOfMemory errors during loading or analysis. Consider loading a subgraph instead.

    • Attached: If the estimated graph size is greater than the graph server (PGX) memory available for allocation in the compute environment settings, then the following warning will be displayed in the slider:

      A graph of this size will likely result in OutOfMemory errors during loading or analysis. Consider loading a subgraph instead.

  10. Optionally, switch on or off the Preserve Case toggle.
    By default, the Preserve Case toggle is switched off.
  11. Optionally, switch on or off the Ignore Invalid Edges Errors toggle.
    The Ignore Invalid Edges Errors toggle determines the behavior for handling edges with missing source or destination vertices when the graph is loaded into memory. When set:
    • ON: It specifies that Graph Studio will ignore those edges with missing source or destination vertices.
    • OFF: This is the default option. It allows you to create the graph when there are edges with missing source or destination vertices. But Graph Studio throws an error when you attempt to load the graph into memory. However, you can reload the graph into memory from the Graphs page by switching on the Ignore Invalid Edges Error toggle. See Load Graph Into Memory for more information.
  12. Click Create Graph to create the property graph.