Understand Decision Model Views
In Processes, you can work on a decision model using either the graph view or the list view.
When you create a new decision model, you’re presented with the graph view by default. You can switch to the list view and vice versa using the Menu button ![]() in the toolbar.
in the toolbar.
Note:
The decision models that you’ve created previously will continue to use the list view as the default view. If you switch to the graph view, you’ll need to redefine the relationships between decisions and input data elements. Similarly, you'll have to redefine the order of the decisions if you switch from the graph view to the list view.Topics:
Graph View
In the graph view, you can create decision requirement diagrams (DRD), in accordance with the DMN standard, to visually represent your decision models.
In decision modeling, a decision requirement graph (DRG) is a self-contained representation of an entire domain of decision-making that displays the important elements in the domain and the relationships between the elements. Whereas, a decision requirement diagram typically depicts a specific view of a DRG; the view depicted can either be partial or complete.
Processes currently supports one DRD per decision model. The following table lists all the available DRD components, which you can use to create your decision models.
| DRD Component | Description | Notation | |
|---|---|---|---|
|
Elements |
Decision |
Denotes a node that determines an output based on its inputs and the logic it contains. |
|
|
Input Data |
Denotes information used as input by one or more decision elements. |
|
|
|
Requirements |
Information Requirement |
Denotes the flow of information from an input data or a decision element to another decision element. |
|
The graph view is divided into the following three areas:
It also contains the Services pane to the left, which is common to both views. To add a service to your model, see Expose Decisions as Services.
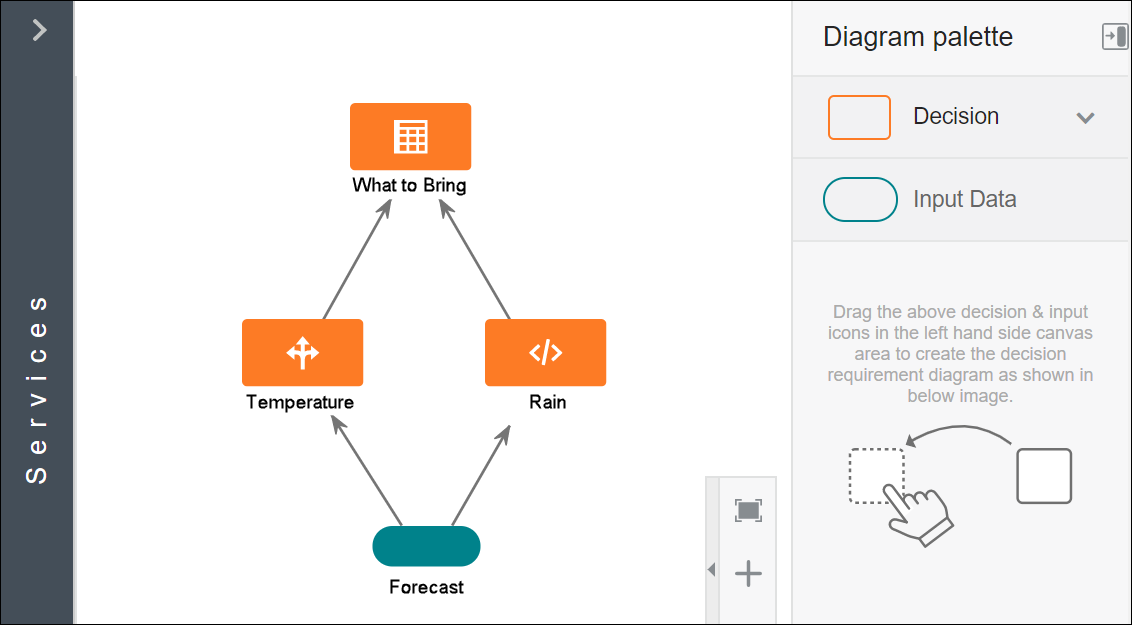
The following figure shows a decision model in the graph view:
Toolbar
The decisions toolbar provides quick access controls to manage the decision canvas.
![]()
| Toolbar Icon | Name | Description |
|---|---|---|
|
|
Pan Mode |
Pan the entire canvas. |
|
|
Select Mode |
Select a particular DRD component. |
|
|
Undo |
Reverse the last change made to your diagram. |
|
|
Redo |
Reverse the last undo action you performed. |
|
|
Auto Layout |
Change the layout of your diagram. Select from the available options. |
|
|
Maximize |
Open the editor in an expanded view. |
|
|
Menu |
Use options in the menu to switch between graph view and list view or promote the model to the gallery. |
|
|
Test |
Test your decision model. |
|
|
Help |
Access usage tips and the tutorial. |
Decision Model Canvas
The decision model canvas is the central area of the graph view. Use the canvas to create a diagram that represents your decision model using the elements available in the diagram palette. The zoom controls at the bottom of the canvas allow you to zoom in or fit the canvas in your browser.
Diagram Palette
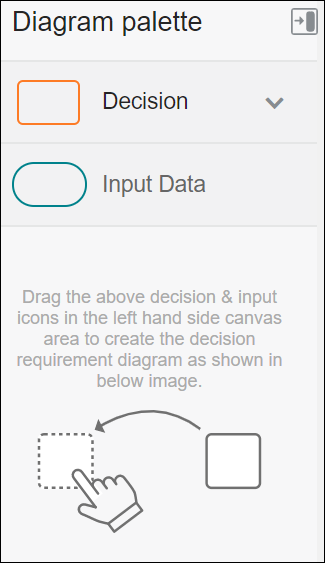
From the diagram palette, drag and drop DRD components onto the canvas to use them in your diagram.
Click Expand ![]() next to Decision on the palette to view all the decision types available for use. You can drag a particular decision type or add an empty decision element and then associate a decision notation to it. Further, order the elements and form connections as required by your overall decision logic. See Add and Order Decisions and Define Decision Input and Type
next to Decision on the palette to view all the decision types available for use. You can drag a particular decision type or add an empty decision element and then associate a decision notation to it. Further, order the elements and form connections as required by your overall decision logic. See Add and Order Decisions and Define Decision Input and Type
Click Collapse ![]() to collapse or expand the diagram palette.
to collapse or expand the diagram palette.
List View
The list view provides a simple interface to add and order your decisions within a model.
Like the graph view, this view too is divided into three areas, namely toolbar, decisions area, and input data. In addition, it contains the Services pane to the left.
Use the controls on the toolbar to undo or redo changes, switch to the graph view, test the decision model, or access relevant documentation. See Toolbar.
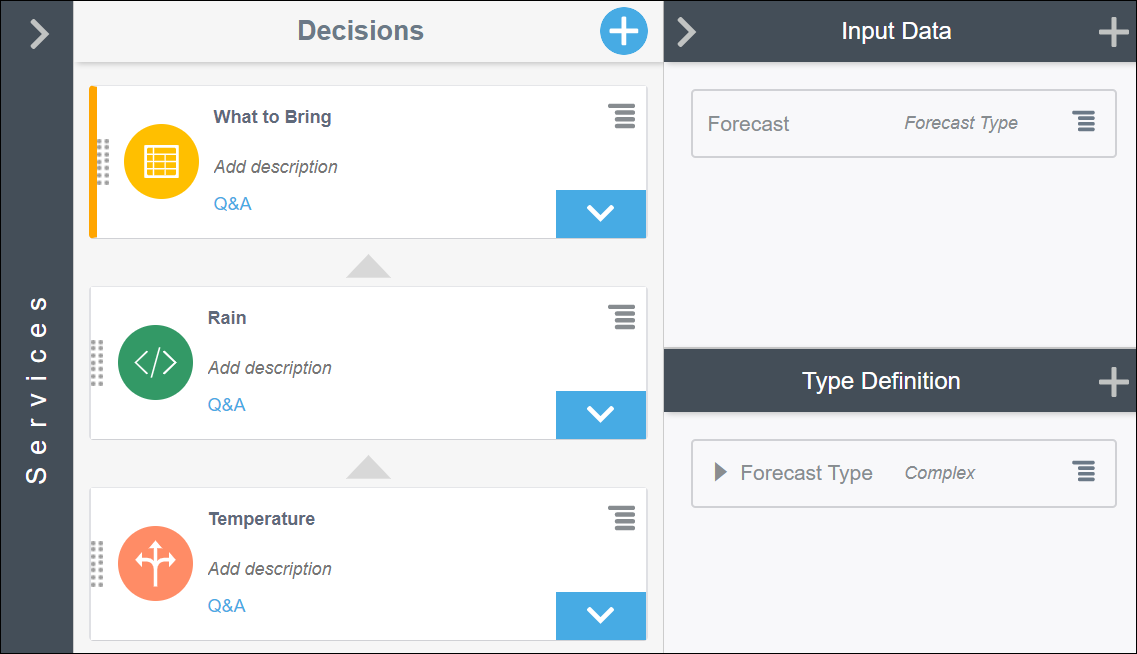
In the decisions area, click Add ![]() to add a new decision to the model. While adding a decision, you can also select its type and enter other preliminary details. The decisions you add are displayed in a list. By default, the first decision you add becomes the final or main decision of the model; however, you can reorder the decisions to suit your logic. See Add and Order Decisions.
to add a new decision to the model. While adding a decision, you can also select its type and enter other preliminary details. The decisions you add are displayed in a list. By default, the first decision you add becomes the final or main decision of the model; however, you can reorder the decisions to suit your logic. See Add and Order Decisions.
Further, expand the Input Data pane to add new type definitions and input data, and expand the Services pane to create a decision service. See Define Decision Input and Type and Expose Decisions as Services.
The following figure shows a decision model created in the list view:


