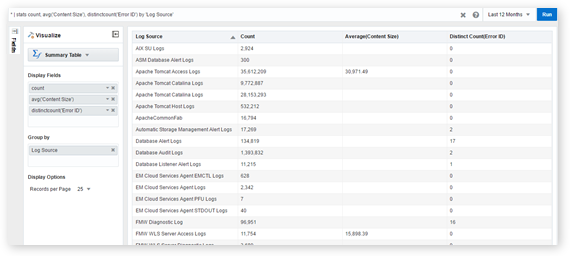
Summary Tables
Using a Summary Table, you can view statistical information about log records in a tabular format.
You can select which measures you want to see, as well as the fields on which to base those measures. Currently, the aggregate functions available in Summary Table are average, count, distinct count, sum, min, max, median, percentile, stddev, values, earliest, and latest. For
timestats command, the aggregate functions like persecond, perminute, perhour, and perday are additionally available.
You can also group the results by any selected fields.
- Search for logs for a set of entities. See Search Logs by Entities.
- From the Visualize panel, select Summary Table (
 ).
). - From the Fields section, drag and drop the required fields.
- Click the down arrow to the right of the selected fields to select the function.
The summary table displays the required result.
To drill-down to a specific value which is used in the group by part of your query, click on the value in the summary table.
Note:
Apart from a Summary Table, all the graph and chart visualization options let you apply multiple statistical functions to your log records.
