View Analytics for a Human Task Activity
Select and click a human task activity in the activity list to view detail analytics report for the human task activity.
By status
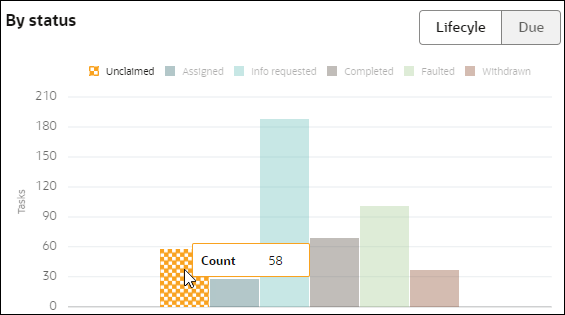
The By status section presents the different states of the human task instances represented by a colored bar chart. The colored bars on the X-axis represents the different states of the task. The Y-axis represents the instance counts of the task. The legends for the different states of the task are present on top. If you hover over a state legend or a state bar on the chart, the other states dim and the selected state gets highlighted in the bar chart.
Hover over a task state bar to know the total task instance count for that state. For example, hovering over the Unclaimed task state bar shows that 58 instances of the human task are unclaimed.

Description of the illustration analytics-ht-bystatus.png
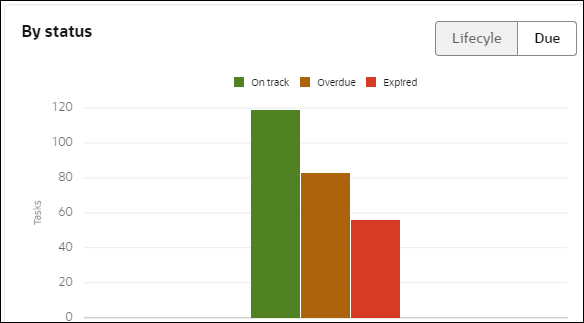
If you select Due, the bar chart view changes to display human task instances that are On track, Overdue or Expired.
By assignee
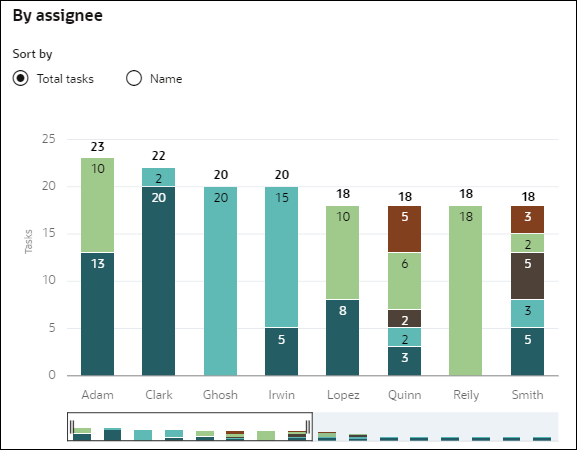
The By assignee section is represented by a stacked bar graph visualization of task instances in their different states assigned to particular users. You can use the Sort by option to sort the stacked bars either by total task counts (Total tasks) or by name of the assignee (Name). If there are more than 8 users assigned to the task, you can use the horizontal scroller to display analytics for other assignees.

Description of the illustration analytics-ht-byassignee.png
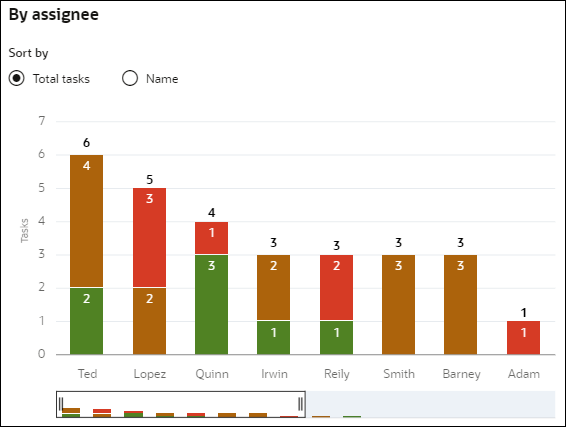
If you select Due, you get a stacked bar graph visualization of task instances that are On track, Overdue or Expired and assigned to different users. The X-axis represents users assigned the task, and the Y-axis represents the total task instance counts. You can sort the visualization data according to total tasks or name of the assignee.

Description of the illustration analytics-byassignee-due.png
Outcome
The Outcome section is displayed only for human task activities of type Approve. It shows the percentage of the human task instances that were approved or rejected. If there are any custom actions that were configured during design time for the activity, then the percentage of task instances for the custom action is also shown. If there are multiple custom actions configured for the human task activity, then you can use the right arrow to scroll to the right and view the percentage of instances for those custom actions.

