View Analytics for a Service Task Activity
Select and click a service task activity in the activity list to view detail analytics report for the service task activity.
Note:
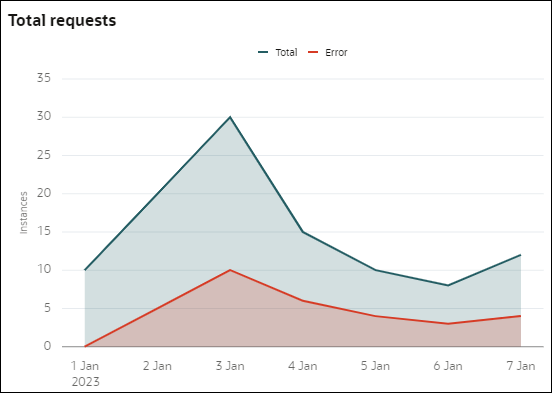
If a service task has any instance that was retried after it failed to run, a badge Retried will be shown for the service task activity under the Started column in the Activity list.Total requests
The Total requests section is a line chart with area that shows the total number of instances and the number of instances that has errors. The X-axis represents the time duration, and the Y-axis represents the total instance counts.
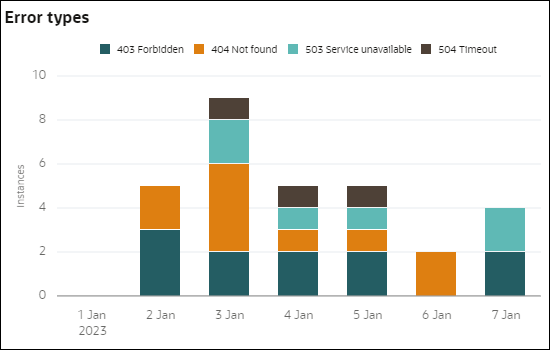
Error types
The Error types section is shown as a stacked bar chart. The stacked bar categorizes the errors that occurred in a particular duration into different error types and shows the cumulative count of errors. The X-axis represents the time duration and the Y-axis represents the total error instances.
For example, if on Jan 3 there were 9 error instances in total, then the stacked bar gives a visualization of those errors according to the different error types - 2 of those errors were 403 Forbidden, 4 errors were 404 Not found, 2 errors were 503 Service unavailable, and 1 error was 504 Timeout.

Description of the illustration analytics-st-errortypes.png
You can also choose to hide a particular error type by clicking the corresponding error legend.
Note that if a service task fails due to REST API error, instead of the visualization charts an error message is shown along with the OPC (Open Platform Communications) request ID using which you can track the error.
