View Analytics for Activities
You can view analytics report for activities in a process and get insights into the performance of the activities.
-
Navigate to the Activity list page of a process.
- From the application level visualization, click the View process details link above the Total instances by process section. By default, the activity list for the first process in the application opens in the graphical view.
-
From the process level visualization, click the View process details link above the Instances by status section. By default, the activity list for the selected process opens in the graphical view.
The details of a process with its activities are available in the Activity list page in two types of visualizations: graphical view and list view. In the graphical and list views, you get high level analytics data for each activity in the process. For example, number of activity instances that were started, number of activity instances that are in progress, the time taken for certain activities to complete, and so on. See Activity list - Graphical view and Activity list - List view.
-
Click an activity to view detail analytics report for the activity. See View Analytics for a Human Task Activity and View Analytics for a Service Task Activity.
Activity list - Graphical view
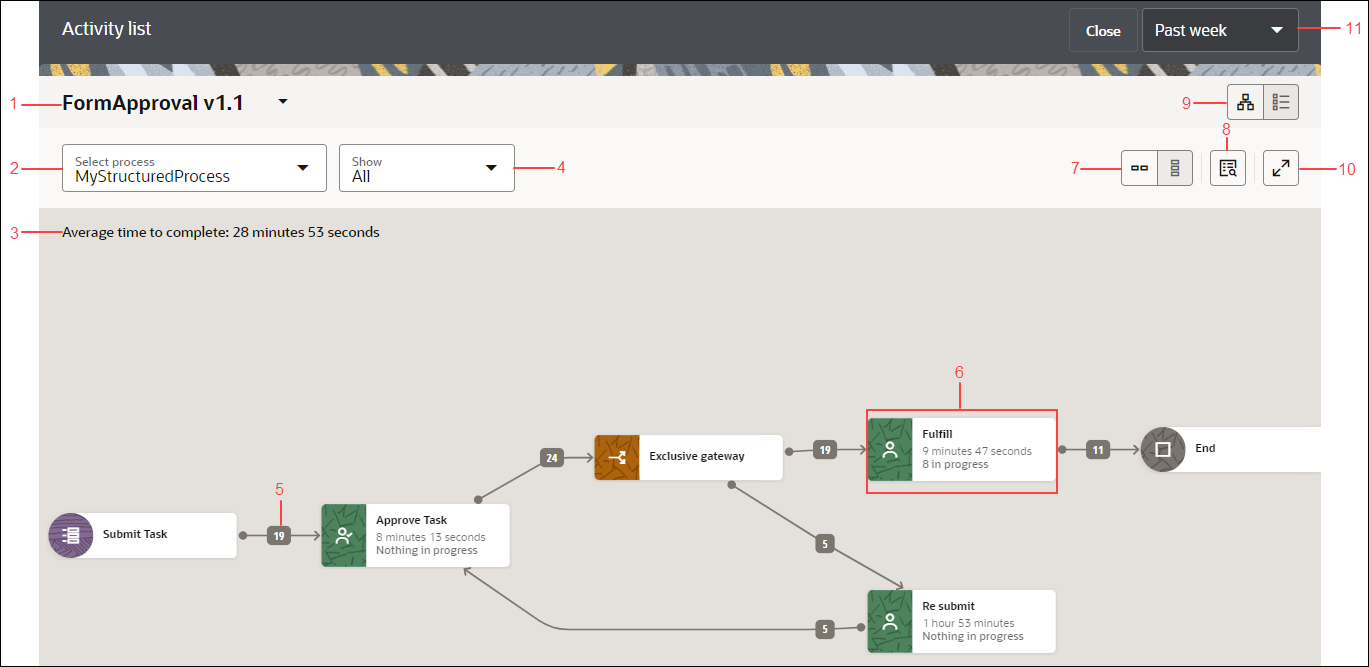
The following is an example of graphical view that shows details of the activities in a structured process along with the activity flow.

Description of the illustration analytics-activity-graphical.png
Note the following in the above example of graphical view:
- The application to which the process (whose activity flow is depicted) belongs. If you want to switch to another application, click the drop-down field and choose a different application from the list.
- The process whose activity flow is graphically represented. All processes available in the selected application version are listed when you click the drop-down field. If you want to switch to another process, choose it from the list.
- The average time taken by the process to complete.
- The Show drop-down field where you can select any of the available filters: Errors, Time, or In progress. By default, All is selected which means no filter is applied. When a filter is selected, only the filtered activities are highlighted in the activity flow, and all other activities are dimmed.
- The number of instances that were started for a particular activity. For example, 19 instances of the form start event (Submit Task) were started.
- Different activities are denoted by different nodes. Hovering over a node, depicts the activity that the node denotes. For example, in this case the node denotes a Submit human task activity. For some activities, you get additional information in the node, such as the time taken for the activity to complete and if the activity is in progress or not. An eye icon on an activity denotes that you can view detail analytics report for the activity. The eye icon is available for human task, service task, upload form and integration activities. See View Analytics for a Human Task Activity and View Analytics for a Service Task Activity.
- Use the Horizontal layout or Vertical layout icons to switch between the two layouts. In this example, Horizontal layout is selected.
- Use the View instances icon to navigate to the Tracking page. See Analytics: Instance Tracking.
- Use the Graphical view or List view icons to switch between the two views. By default, graphical view is selected.
- Use the Maximize icon to maximize the window.
- The time period for which the analytics report is displayed. Click the drop-down field to choose another time period option from the list. The options are Past week, Past month, Past year, and Custom.
Activity list - List view
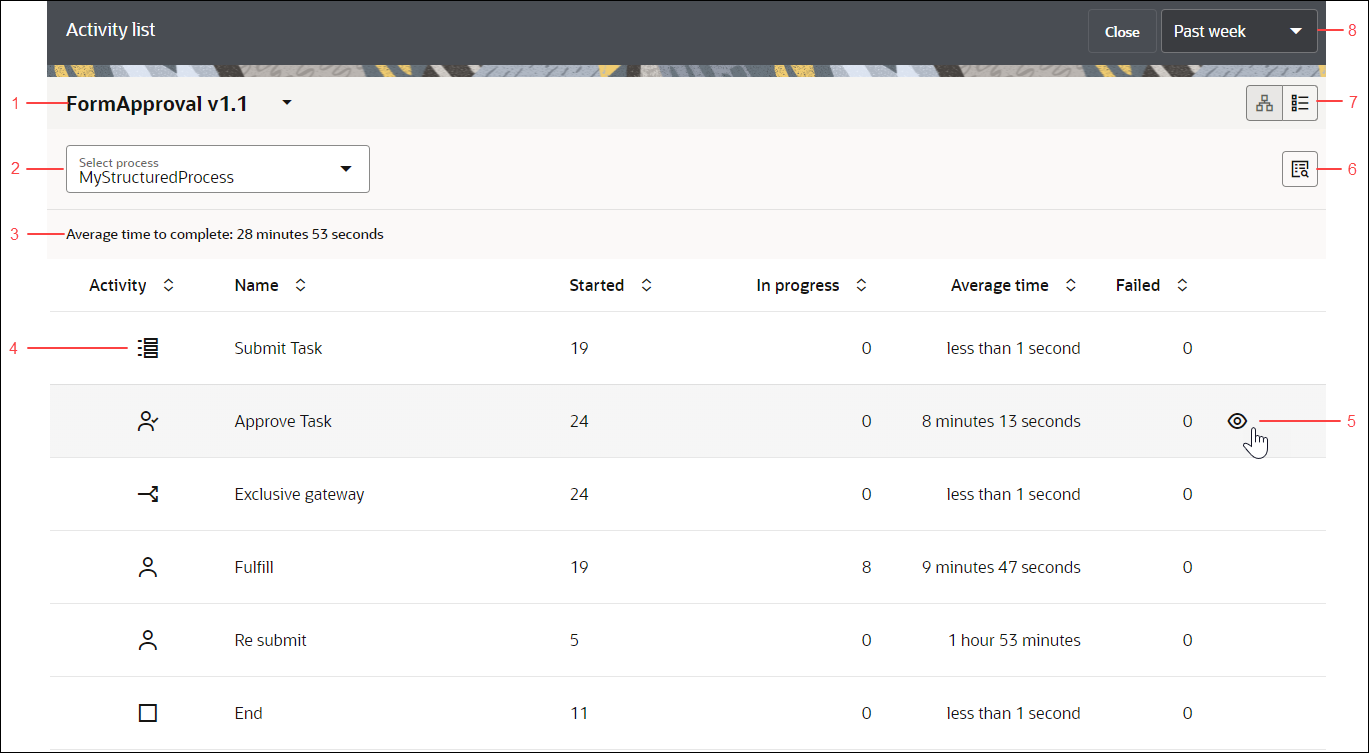
The following is an example of list view that shows details of the activities in a structured process.

Description of the illustration analytics-activity-list.png
Note the following in the above example of list view:
- The application to which the process (whose activities are displayed) belongs. If you want to switch to another application, click the drop-down field and choose a different application from the list.
- The process whose activities are displayed in the list view. All processes available in the selected application version are listed when you click the drop-down field. If you want to switch to another process, choose it from the list.
- The average time taken by the process to complete.
- Different icons are used to denote different types of activities. In this case, the form start event icon is highlighted. Hovering over an icon reveals the type of activity that the icon denotes.
-
An eye icon is displayed on selecting a human task, service task, upload form and integration activity. The eye icon indicates that you can view detail analytics report for the activity. See View Analytics for a Human Task Activity and View Analytics for a Service Task Activity.
- Use the View Instances icon to navigate to the Tracking page. See Analytics: Instance Tracking.
- Use the Graphical view or the List view icons to switch between the two views. In this example, the list view is selected.
- The time period for which the analytics report is displayed. Click the drop-down field to choose another time period option from the list. The options are Past week, Past month, Past year, and Custom.
Some key points to note in the graphical and list views
- Stages in a dynamic process are by default shown in expanded view depicting all activities inside it.
- Subprocesses in a structured process are by default shown in collapsed view. Expand the subprocess to view the activities inside it and their flow.
- Call activity in a structured process is shown with a link to the called process. Click the link to navigate to the called process.
- Multi-instance activities are shown with respective icons to denote if they are parallel multi-instance or sequential multi-instance activities. Examples:
- Parallel multi-instance activity (graphical view):

- Sequential multi-instance activity (graphical view):

- Parallel multi-instance activity (list view):

- Sequential multi-instance activity (list view):

- Parallel multi-instance activity (graphical view):
-
If the process flow has been altered by manual intervention, for example certain activities were skipped, the altered flow of the process is depicted as a new line between the start and target activities. To indicate that this action was performed outside the normal flow of the process, a human icon is present in the transition line and the color of the line is different from the normal flow.
In the below example, the altered flow is depicted by the orange flow line and the human icon on the line indicates that the flow has been altered by manual intervention.

Description of the illustration alterflow-graphical-view.png