View Analytics for a Process
You can view analytics report for a process and get insights into the instances of the process over a period of time.
- Search and select the process from the search field.
- Click the process from the X-axis in the stacked bar graph.
Analytics reports for the instances in the process are displayed in the form of three views.
In addition, you can also drill down and get analytics for a particular day.
Tip: A quick way to switch to a different process in the application is to use the filter chip displayed for the process below the search field.
Status over time
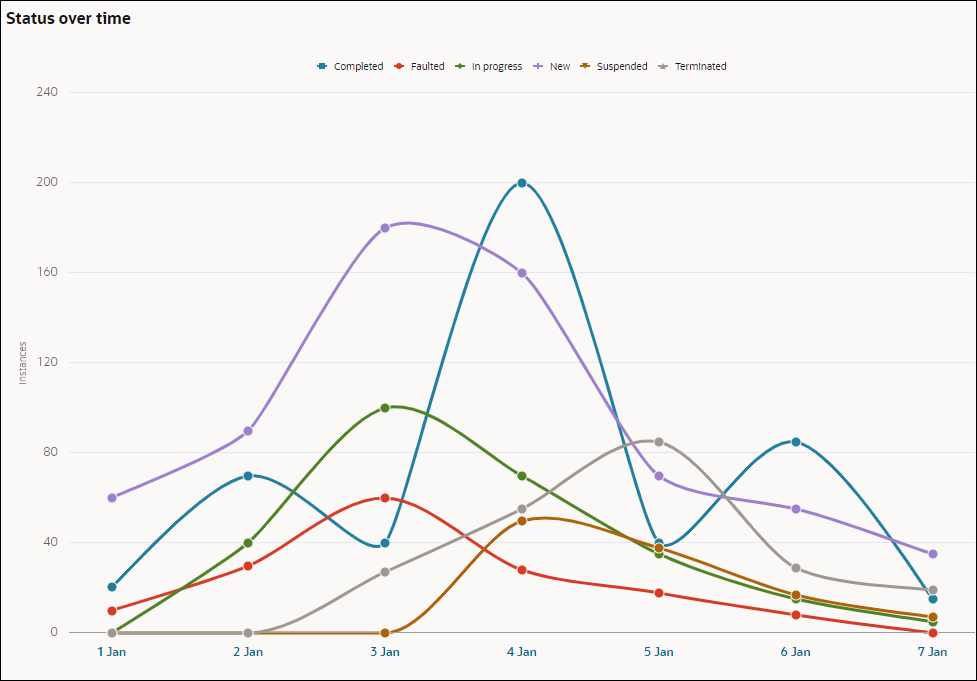
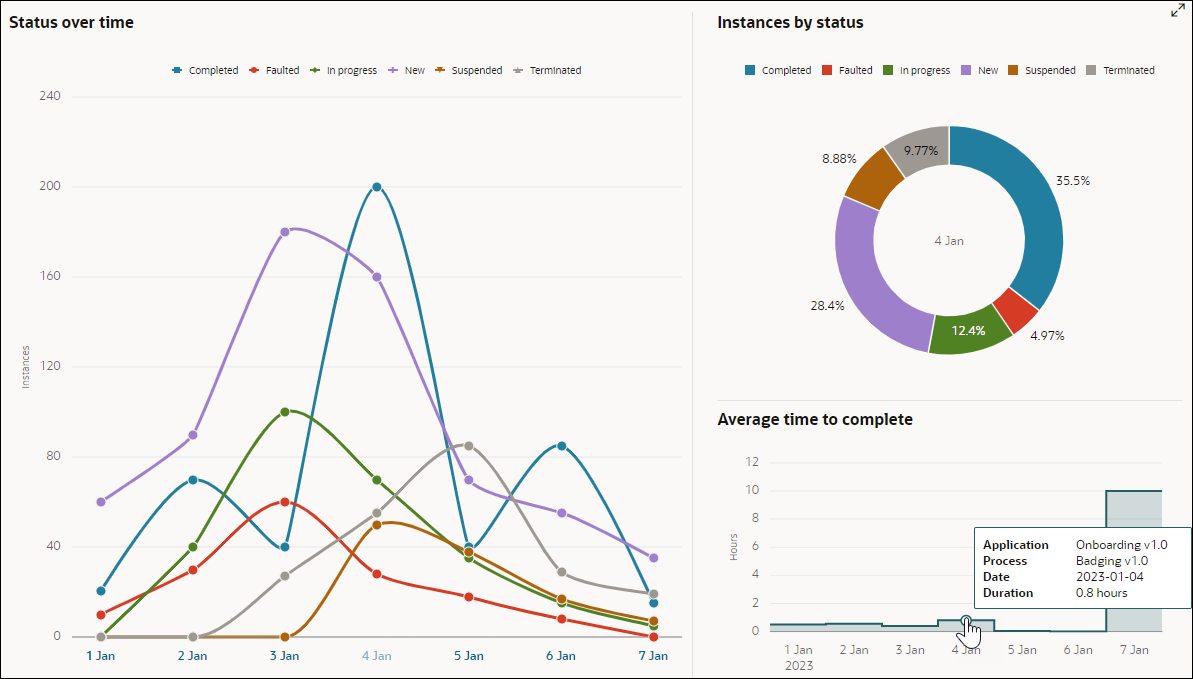
The Status over time section is present on the left where different states are represented by colored line graphs. The total instance counts for different states is shown over a duration that is selected in the Period field. The X-axis represents the time duration, and the Y-axis represents the total instance counts.
For example, if the period selected is past week, then you can view the total instance counts for different states on a given day in that week.
Description of the illustration analytics-status-time.png
You can hover over a plotted point in a line graph to view the total instances in the selected state on that particular day.
Instances by status
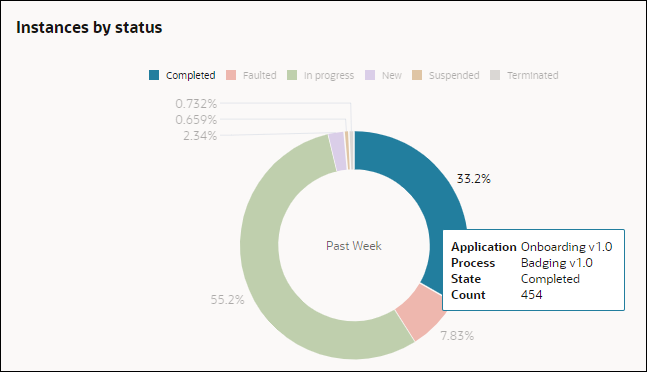
The Instances by status section is represented by a doughnut chart. By default, a summary view is shown in the doughnut chart based on the duration selected. The percentage value for the different instance states in the selected duration is shown on the rings of the doughnut chart.
You can hover over a state ring in the doughnut chart to view the total instance count for that state.
Description of the illustration analytics-instance-status.png
Average time to complete
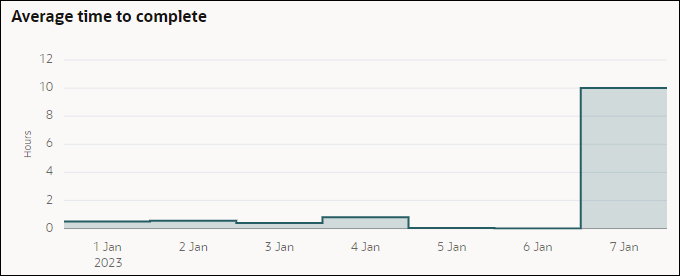
This chart shows the average time to complete in a line with area graph. Based on the duration selected, the average time taken to complete the process is presented in a line with area.
Get analytics for a particular day
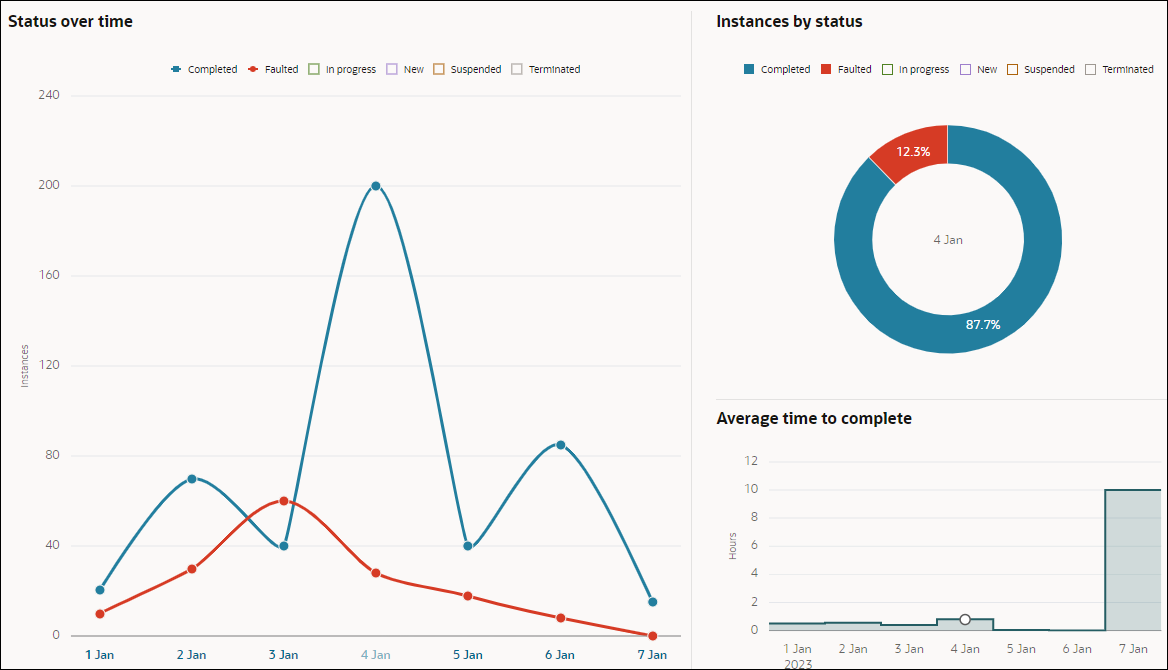
To view analytics report for a day, from the process level visualization select the date in the X-axis of the Status over time chart. The visualization in the related Instances by status and Average time to complete charts on the right changes to show the reports for the selected day.
In the following example, on selecting Jan 4 in the X-axis of the Status over time chart, the Instances by status section's doughnut chart presents a visualization of the percentage of process instances in different states on Jan 4. The line with area chart of the Average time to complete section shows the average time that process instances took to complete on Jan 4.
Description of the illustration analytics-day-wise.png
Note that if there are no Completed instances present in the process, then the Average time to complete section won't show any data.
As in the application and process level views, in the daily view too the state legends are interactive. Hover over a state legend on top or a state line graph of the Status over time section to highlight that state in the graph. The state also gets highlighted in the doughnut chart of the Instances by status section.
If you want to filter and view the instances in a particular state then disable the other states by clicking the state legends.
In the following example, the In progress, New, Suspended and Terminated states are disabled to get a visualization with only the Completed and Faulted states.
