B2B Campaign performance
The campaign performance pages (One time campaigns and Recurring campaigns) display a breakdown of historical performance metrics.
Accessing the campaign performance pages
To access the campaign performance pages:
-
Click the Oracle icon
 in the bottom-right corner to open the navigation menu.
- Select One time campaigns or Recurring campaigns.
Tip: You can also reach the Campaign performance pages by clicking Details in the One-time campaign and Recurring campaign widgets on the homepage dashboard.
Reviewing campaign performance
Each campaign performance page gives you an expanded view of metrics and campaign information..
One time campaigns
The One time campaigns page gives a more expansive look at metrics for each one time campaign. By default, the campaigns are sorted in descending order by Launch date (most recent date first).
The following diagram describes the layout of the information and the customization options on the page.
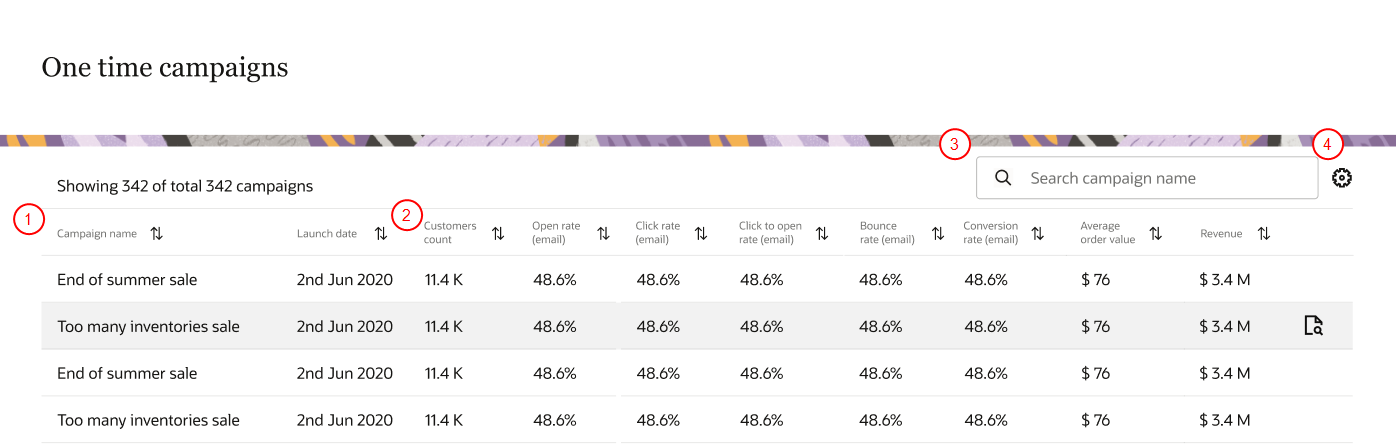
 Campaign information: You can review the following campaign information for each campaign.
- Campaign name: Name used to identify the campaign throughout the application.
- Launch date: Date the first messages of the campaign were sent.
 Columns: The following columns are available to view.
Channel: View the outbound channels of campaign activation.
The following metrics are available to select as columns.
- Bounce rate
- Click rate
- Click-to-open rate
- Contact count
- Delivery rate
- Form submission rate
- Open rate
- Productive clicks
- Total clicks
- Total delivered
- Unique clicks
- Unique opens
To see descriptions of metrics, review B2B Dashboard metrics.
If you notice a one time campaign is not performing as expected, you can do a campaign analysis. Learn more about Analyzing B2B campaigns.
 Search : Look for campaigns by name.
 Column visibility settings: Click the customization gear
 ![]() to customize the what metrics to display on the page. Use the checkboxes to select metrics and click Apply.
to customize the what metrics to display on the page. Use the checkboxes to select metrics and click Apply.
Recurring campaigns
The Recurring campaigns page gives a more expansive look at metrics for each active recurring campaign. By default, the campaigns are sorted in descending order by Campaign name.
The following diagram describes the layout of the information and the customization options on the page.
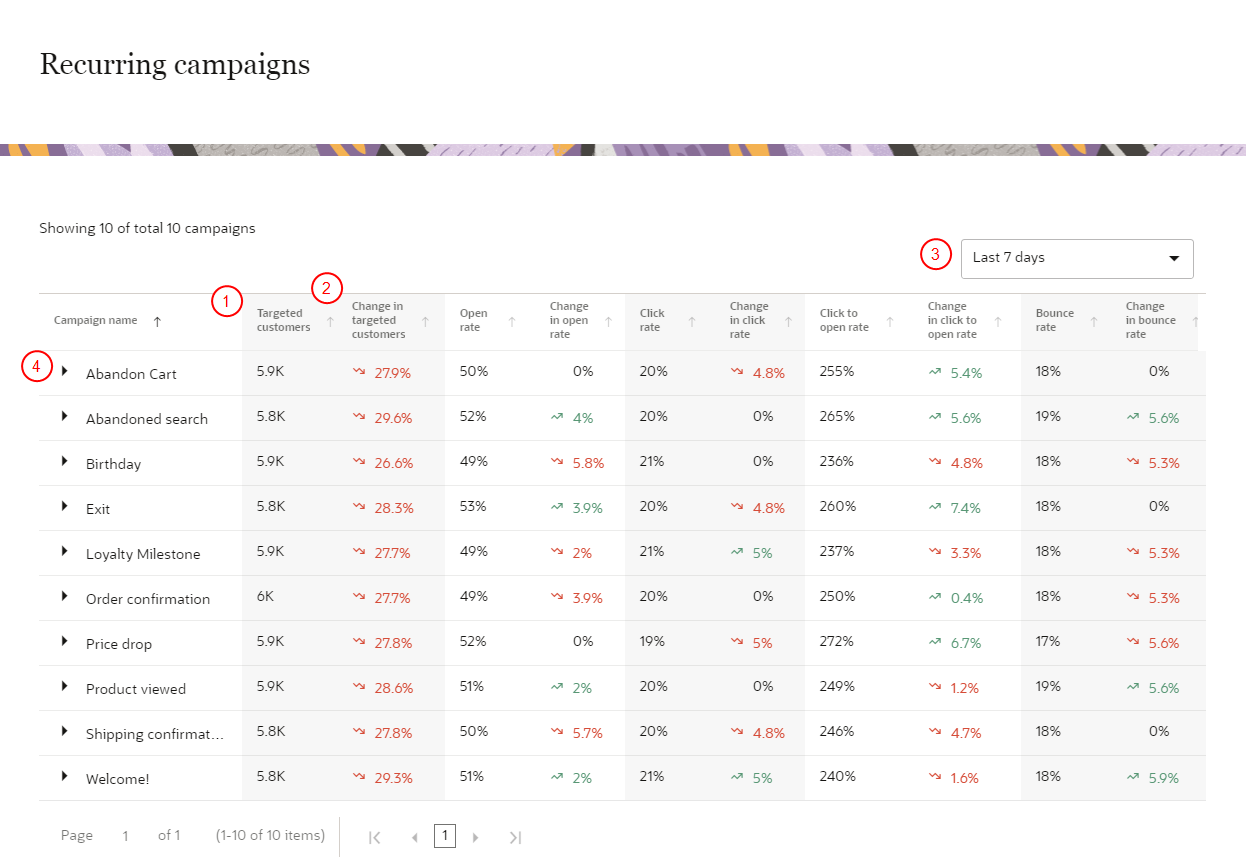
Metrics: The following metrics are available.
- Bounce rate
- Click rate
- Click-to-open rate
- Contact count
- Open rate
To see descriptions of metrics, review B2B Dashboard metrics.
Change in metric: The column next to each metric displays the percentage change in the performance of the metric over the previous time period selected.
Time period: You can select to group data in the following aggregated time periods.
- Last 7 days
- Last 14 days
- Last 30 days
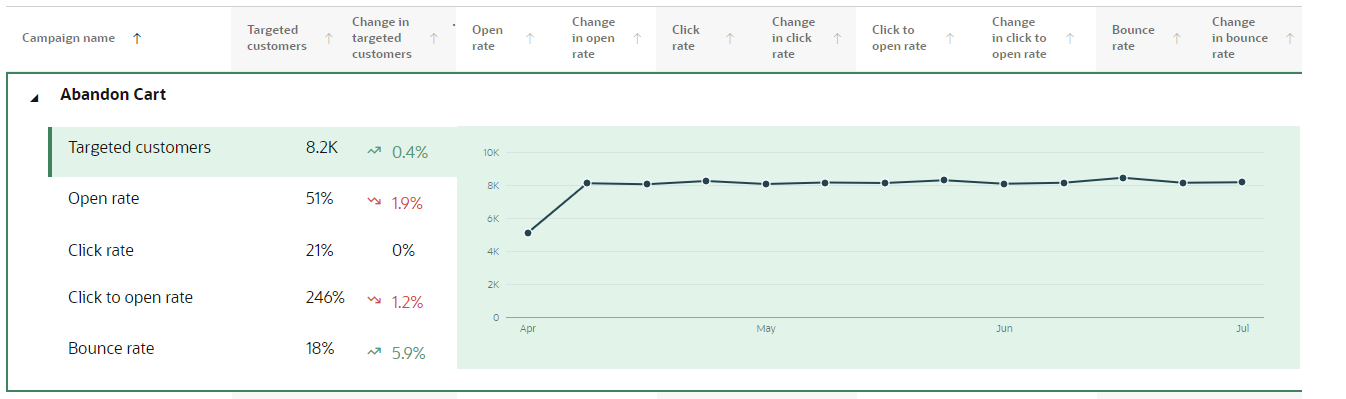
Campaign historical performance : To get a deeper look into a campaign, click the arrow next to the campaign name. This will open up the historical performance of the campaign going back 90 days.
Managing B2B dashboard widgets