B2B Dashboard widgets
Dashboard widgets display data about your contacts and campaign performance.
- The data in the widgets represent all accounts/contacts.
- The campaign data used for creating the widgets is imported from Oracle Eloqua.
You can review widgets and visit the analytics dashboard by clicking the navigation menu in the bottom-right corner ![]() and selecting Home.
and selecting Home.
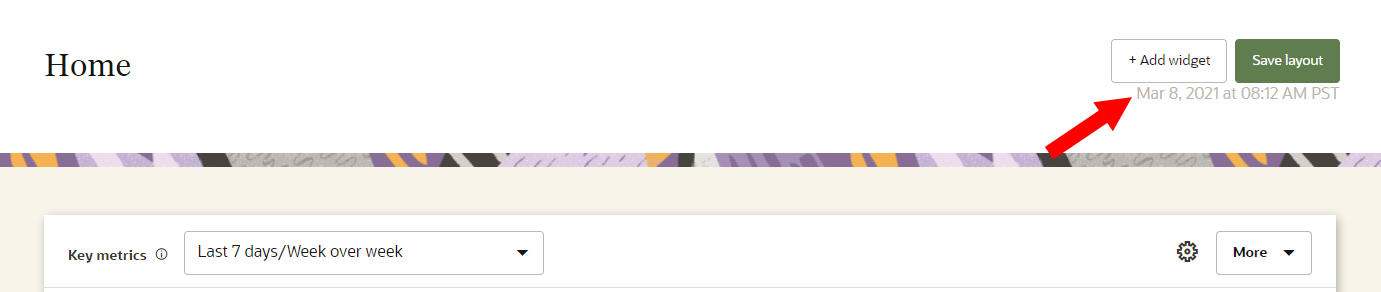
Verify the last update for dashboard data
You can verify the last time the dashboard data was refreshed by reviewing the timestamp in the top-right corner of the page. The time displayed represents your local time.
The following widgets are available.
Key metrics widget
The Key metrics widget displays important contact metrics to your organization and allows you to assess the current state of your contact base. . There are two types of metrics available.
- Performance metrics: Assessing key performance indicators over a set period of time. For example, Average order value or Click rate.
- Contact metrics: Calculating the number of contacts that performed an action over a set period of time. For example, Purchasers or Engaged contacts.
The following key metrics are available.
- Bounce rate
- Click rate
- Click to open rate
- Delivery rate
- Engaged contacts
- Form submission rate
- Open rate
- Productive clicks
- Revenue
- Subscribed
- Total clicks
- Total delivered
- Total form submissions
- Total page views
- Total web visits
- Unique opens
- Unique clicks
- Unsubscribed
- Web visitors
To see descriptions of metrics, review B2B Dashboard metrics.
The following diagram describes the layout of the information and the customization options in the widget.
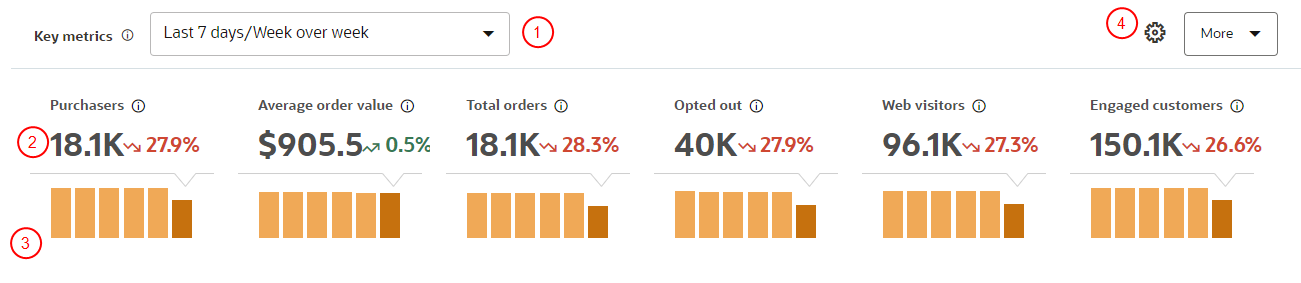
 Time period: The time period for the data displayed. You can select from the following time periods:
- Daily/Past week
- Last 7 days/Week over week
- Last 14 days/Bi-weekly over bi-weekly
- Last 30 days/Month over month
 Current value and percentage change: The current value of the key metric over the time period selected is displayed in black. The percentage change of the metric when compared to the previous time period is displayed in green (increase) or red (decrease).
 Historical performance: The historical trend of the key metric over the past six time periods. The black bar in the graph represents the value of the metric for the most recent time period, and the blue bars represent previous time periods. Hover your mouse over individual bars to view specific dates and exact values for the metric.
 Customize Key metrics and More:
- Click the customization gear
 to customize the metrics in the widget. Learn more about Editing widgets.
 - Click More to expand the widget and view more metrics.
One time campaigns widget
The One time campaigns widget displays the performance of up to the 10 most recent one time campaigns that have occurred within the last 90 days.
A one time campaign is a campaign that is geared for a specific marketing event, and all of its marketing messages are sent out within seven days of the launch date. An example of a one time campaign might be 2019 Thanksgiving holiday weekend sale.
The following diagram describes the layout of the information and the customization options in the widget.
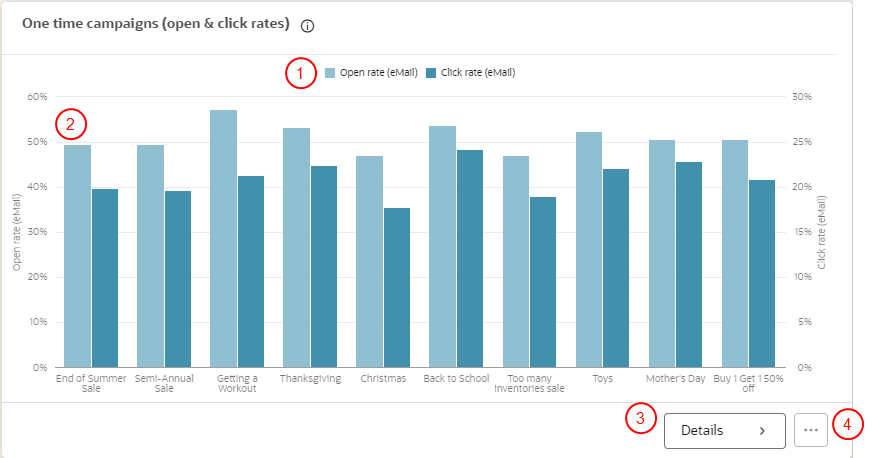
Metrics : You can customize the widget from the Edit screen to display any two of the following metrics.
- Bounce rate
- Click rate
- Click-to-open rate
- Delivery rate
- Form submission rate
- Open rate
- Productive clicks
- Total clicks
- Total delivered
- Unique clicks
- Unique opens
To see descriptions of metrics, review B2B Dashboard metrics.
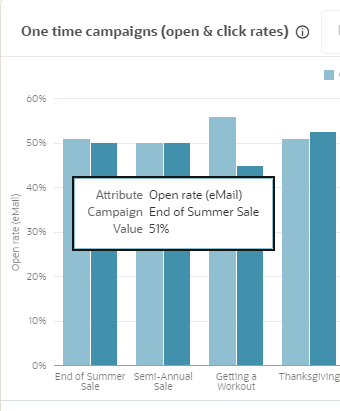
Metric details: Hover your mouse over individual bars in the widget to display the following information: Campaign name, Name of metric, and Value of metric.
One time campaigns performance: Click Details to visit the One time campaigns page and get a more detailed look at the performance of your one time campaigns. Learn more about Campaign performance.
Action menu: click the Action menu ![]() and select Edit. Learn more about Editing widgets.
and select Edit. Learn more about Editing widgets.
Recurring campaigns widget
The Recurring campaigns widget displays the performance of active recurring campaigns, which are defined as campaigns that have had triggered events in the time period selected and also the time period prior to that triggered event.
A recurring campaign is a campaign whose marketing messages are sent based on triggers of a contact's behavior or their profile. Here are two examples of recurring campaigns:
- Contacts receive marketing messages when they abandon their online shopping cart.
- Contacts receive birthday messages on their birthday.
The following diagram describes the layout of the information and the customization options in the widget.
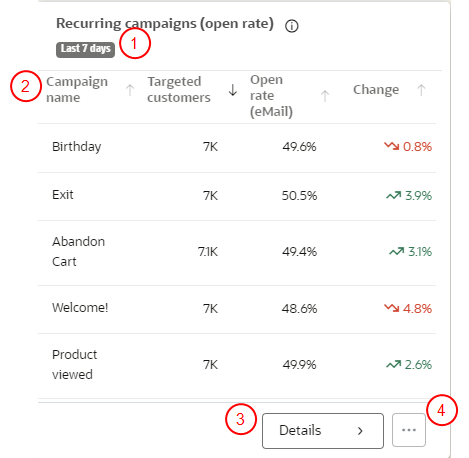
Time period: Represents the time period for the data displayed in the widget. You can update the time period from the Edit screen to Last 7 days, Last 14 days, or Last 30 days.
Campaign details: The widget displays the following campaign details.
- Contact count
- Metric of your choice: You can select to include one of the following metrics to the widget, which will display the metric value for each campaign. You can change the metric from the Edit screen.
- Bounce rate
- Click rate
- Click-to-open rate
- Open rate
- Productive clicks
- Total clicks
- Total delivered
- Unique clicks
- Unique opens
- To see descriptions of metrics, review B2B Dashboard metrics.
- Change: The percentage change of the selected metric compared to the previous time period.
Example: You would like to view the change in open rate of a campaign from the past week. You select the time period of 7 days. The Change value will compare the open rate from the past 7 days to the open rate from 8-14 days ago and show the percentage increase or decrease.
Recurring campaigns performance: Click Details to visit the Recurring campaigns page and get a more detailed look at the performance of your recurring campaigns. The time period you select in the widget will automatically be applied to the Recurring campaigns page. Learn more about Campaign performance.
Action menu: click the Action menu ![]() and select Edit. Learn more about Editing widgets.
and select Edit. Learn more about Editing widgets.
Tip: The columns in the Recurring campaigns widget are sortable. Click the arrow next to a column name to sort it in ascending or descending order.
Comparative trends widget
The Comparative Trends widget displays trends of up to four metrics over time. The graph in the widget displays the percentage change of the metric compared to the previous time period.
The left-side of the widget displays the current value of each metric according to the last data point in the widget and the time period selected. For example, if the time period is Weekly, the value represents the how the metric performed over the past 7 days.
Metrics
The following metrics are available.
- Bounce rate
- Click rate
- Click-to-open rate
- Engaged contacts
- Open rate
- Productive clicks
- Subscribed
- Unsubscribed
- Total clicks
- Targeted contacts
- Total delivered
- Total page views
- Unique clicks
- Unique opens
- Visits
- Web visitors
To see descriptions of metrics, review B2B Dashboard metrics.
You can update the metrics for the widget from the Edit screen under Metric Types. Learn more about Editing widgets.
Time period options
You can view the current time period selections under the widget title. Click the Action menu ![]() and select Edit to manage the time period options.
and select Edit to manage the time period options.
- To update how to group the data in aggregated time periods, update Time period to Daily (last 14 days)or Weekly (last 90 days).
- If you select Daily, the look back time is 14 days. If you select Weekly, the look back time is 90 days.
Top products widget
The Top products widget displays information on the top-performing products based on the metric and time period selected.
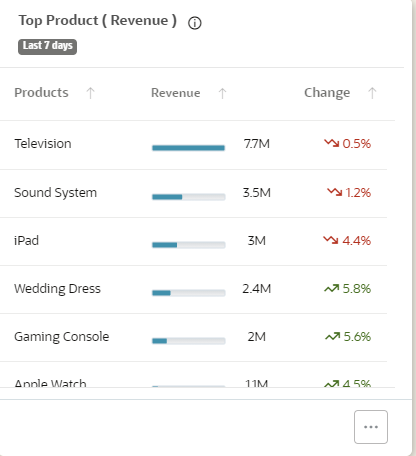
You can select to view the top products based on the following metrics: Average order value, Orders, Revenue, or Returns.
After configuring the information in the widget, you can sort the data based on the following:
- The top products based on the highest values of the metric for the time period.
- The worst products based on the lowest values of the metric for the time period.
- The most improved products based on the percentage change in value of the metric for the current time period compared to the previous time period. For example, if you select Revenue and Last 7 days,, the widget will display the products that have the greatest improvement in revenue over the last 7 days compared to the 7 days prior.
- The worst performing products based on the percentage change in value of the metric for the current time period compared to the previous time period. For example, if you select Revenue and Last 7 days,, the widget will display the products that have the worst performance in revenue over the last 7 days compared to the 7 days prior.
Time period options
Click the Action menu ![]() and select Edit to manage the time period options. The current time period is displayed under the widget title. To manage the overall look back time, update Time period to Last 7 days, Last 14 days, or Last 30 days.
and select Edit to manage the time period options. The current time period is displayed under the widget title. To manage the overall look back time, update Time period to Last 7 days, Last 14 days, or Last 30 days.
Managing B2B dashboard widgets