Open Requests
The Open Requests dashboard provides an overview of requests currently active in the system.
You can use this tab to understand how open requests are distributed by stage or status, as well as by data chain or view.
For details on the actions that you can take in the dashboard panels, see Working with Dashboard Panels. Exceptions to these actions are described in the sections for each dashboard panel, below.
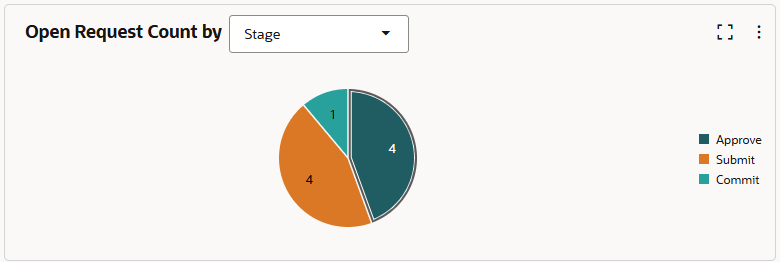
Open Request Count by (Stage, Status, Priority, or Request Type)

The Open Request Count by (Stage, Request Status, Priority, or Request Type) panel displays the number of open requests grouped by the request stage, status, priority, or type, based on your filter.
For each element in the chart, you can drill down to view the request activity, drill
across to view the requests in another visualization, or apply the specifics of that
element to the page filter. You can also use the Actions menu
![]() to view and download the request activity in the visualization. See Working with Dashboard Panels.
to view and download the request activity in the visualization. See Working with Dashboard Panels.
Open Request Distribution by (Application or View)

The Open Request Distribution by (Application or View) panel shows how the open requests in your filter bar are distributed across applications, dimensions (if one application is selected in your filter), views, or viewpoints (if one view is selected in your filter).
For each element in the chart, you can drill down to view the request activity, drill
across to view the requests in another visualization, or apply the specifics of that
element to the page filter. You can also use the Actions menu
![]() to view and download the request activity in the visualization. See Working with Dashboard Panels.
to view and download the request activity in the visualization. See Working with Dashboard Panels.
Outstanding Requests Snapshot

The Outstanding Requests Snapshot panel provides a direct means for taking action on individual requests that may need intervention in order to advance. The panel displays information about the requests such as the request type, stage and status, age, the number of items, and workflow information such as the number of approvers and contributors.
You can click the title of a request to either open or inspect it, and you can click
the name of a view to inspect it. Otherwise, the elements in the panel cannot be
further drilled down or across. You can use the Actions menu
![]() to view and download the request activity in the visualization. See Working with Dashboard Panels.
to view and download the request activity in the visualization. See Working with Dashboard Panels.
Note:
If you navigate to a request from the dashboard, you have the option to close the request and then return to the dashboard without losing your dashboard tab and filter settings.