Approval Cycle Time
The Approval Cycle Time card displays information on how long requests are spending in each workflow stage and how long it takes for requests to be approved by priority or request owner.
Note:
Cycle time in the dashboard panels is displayed in increments of days. So a cycle time of .5 represents 50% of a day, or 12 hours.
For details on the actions that you can take in the dashboard panels, see Working with Dashboard Panels.
Average Stage Cycle Time by (Application, Dimension, or Request Type)

The Average Stage Cycle Time by (Application, Dimension, or Request Type) panel displays the average number of days that requests spent in the Submit, Approve, and Commit stages by application, dimension (if there is a single application selected in the filter bar), or request type.
The start and end time for the stages is defined as follows:
Table 17-1 Stage Start and End Times
| Stage | Start | End |
|---|---|---|
| Submit | A request is initially created (for example, clicking New Request for an interactive request). | The request is submitted. |
| Approve | Request is promoted to the Approve stage | Final approval is received |
| Commit | Request is promoted to the Commit stage | Final commit is received |
For each element in the chart, you can drill down to view the request activity, drill
across to view the requests in another visualization, or apply the specifics of that
element to the page filter. You can also use the Actions menu
![]() to view and download the request activity in the visualization. See Working with Dashboard Panels.
to view and download the request activity in the visualization. See Working with Dashboard Panels.
Average Approval Cycle Time by Priority

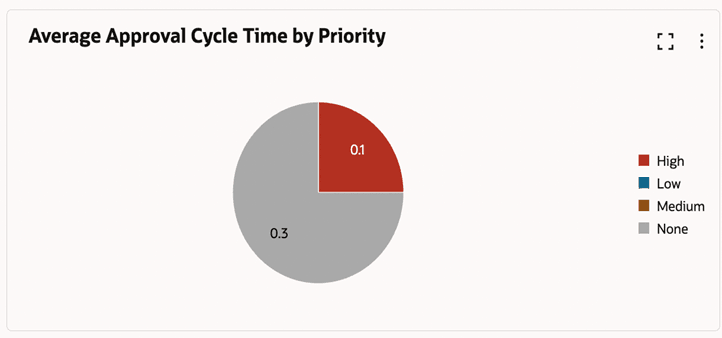
The Average Approval Cycle Time by Priority panel displays a pie chart showing the average number of days it took for requests to be approved based on their priority.
The data elements in this chart cannot be drilled across or applied to the current
filter. You can use the Actions menu ![]() to view and download the request summary in the visualization. See Working with Dashboard Panels.
to view and download the request summary in the visualization. See Working with Dashboard Panels.
Approval Cycle Time by Request Owner

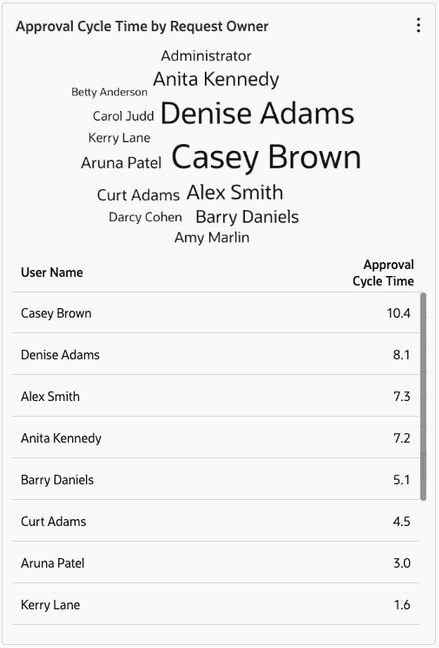
The Approval Cycle Time by Request Owner panel displays the average number of days it took for requests to be approved, grouped by request owner (that is, the person who submitted the request). The visualization is presented as a tag cloud, with request owners with longer cycle times displayed in bigger font sizes. The owners are also displayed in a table with the average approval cycle time for each owner.
For each element in the chart, you can drill down to view the request activity, drill
across to view the requests in another visualization, or apply the specifics of that
element to the page filter. You can also use the Actions menu
![]() to view and download the request summary in the visualization. See Working with Dashboard Panels.
to view and download the request summary in the visualization. See Working with Dashboard Panels.