Request Cycle Time
The Request Cycle Time card displays information on how long it takes requests to close based on various factors, such as the request type, the application, or the number of request items.
This enables you to analyze potential problem areas that can cause requests to take longer than expected to complete.
Note:
Cycle time in the dashboard panels is displayed in increments of days. So a cycle time of .5 represents 50% of a day, or 12 hours.
For details on the actions that you can take in the dashboard panels, see Working with Dashboard Panels.
Average Cycle Time by (Application, Dimension, Request Type, or Request Owner)

The Average Cycle Time by (Application, Dimension, Request Type, or Request Owner) panel displays statistics on how long on average it took for requests to complete based on the application, dimension (if one application is selected in the filter bar), request type, or request owner.
The columns in the panel display the following information:
- Requests Closed: The number of requests (per application, dimension, request type, or request owner) that were closed in the time frame specified in the filter bar.
- Cycle Time From Create is the average amount of time that a request took to close from the time a request is initially created (for example, clicking New Request for an interactive request).
- Cycle Time from Submit is the average amount of time that a request took to close from the time that a request owner clicked the Submit button.
- (All other columns): Display various statistics about the requests, such as the average number of items and request actions that were in the requests, and the average number of approvers and request approvals per request.
Click each column header to sort the chart in ascending or descending order by that column.
For each element in the chart, you can drill down to view the request activity, drill
across to view the requests in another visualization, or apply the specifics of that
element to the page filter. You can also use the Actions menu
![]() to view and download the request summary in the visualization. See Working with Dashboard Panels.
to view and download the request summary in the visualization. See Working with Dashboard Panels.
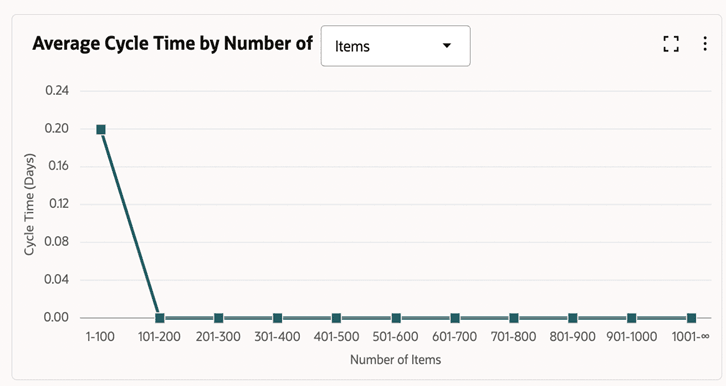
Average Cycle Time by Number of (Items or Contributors)

The Average Cycle Time by Number of (Items or Contributors) panel displays a distribution of the average number of days it took for requests to be closed by the number of items or contributors on the request.
The data elements in this chart cannot be drilled across or applied to the current
filter. You can use the Actions menu ![]() to view and download the request summary in the visualization. See Working with Dashboard Panels.
to view and download the request summary in the visualization. See Working with Dashboard Panels.
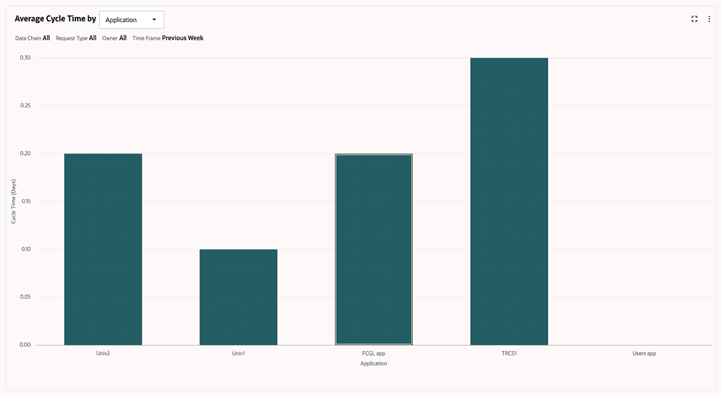
Average Cycle Time by (Application or Dimension)

The Average Cycle Time by (Application or Dimension) panel displays the average number of days it took for requests to be closed broken down by application or dimension (if a single application is selected in the filter bar).
For each element in the chart, you can drill down to view the request activity, drill
across to view the requests in another visualization, or apply the specifics of that
element to the page filter. You can also use the Actions menu
![]() to view and download the request summary in the visualization. See Working with Dashboard Panels.
to view and download the request summary in the visualization. See Working with Dashboard Panels.