Closed Requests Overview
The Closed Requests Overview card displays trend information about request completion over time by data object.
The dashboard panels on this card help you identify the applications and dimensions that require longer cycle times to complete. You can drill across on an application or dimension to the Request Cycle Time or Approval Cycle Time cards to analyze other factors in play for those objects, such as the number of items or contributors involved.
For details on the actions that you can take in the dashboard panels, see Working with Dashboard Panels. Exceptions to these actions are described in the sections for each dashboard panel, below.
Note:
When you download the Closed Request Summary for any of the visualizations on this card, the request summary is grouped by dimension. If you have a request that contains request items from multiple dimensions, it will be displayed multiple times in the summary (once for each dimension).Closed Requests Trend by (Data Chain Object and Time Period)

The Closed Requests Trend by (Data Chain Object and Time Period) panel displays the number of closed requests by either view or application (or dimension if there is a single application selected in the Data Chain filter bar) over a specific time period. By default, it displays data by Application and Month. Click the hyperlink in the title to change the data chain object or to adjust the time period. You can select a time period within the Time Frame that is selected in the filter bar (for example, when the Time Frame is set to Year to Date, you can select Month or Quarter).
The data elements in this chart cannot be drilled across or applied to the current
filter. You can use the Actions menu ![]() to view and download the request summary in the visualization. See Working with Dashboard Panels.
to view and download the request summary in the visualization. See Working with Dashboard Panels.
Request Exception Impact Analysis by (Data Chain Object)

The Request Exception Impact Analysis by (Data Chain Object) panel displays information about how many requests had exceptions (such as escalations, recalls, and push backs) that may have impacted their time to close. You can display the panel by view or application (or dimension if there is a single application selected in the Data Chain filter bar). The total number of each type of exception is displayed, along with a percentage of that exception of the total number of closed requests.
Click each column header to sort the chart in ascending or descending order by that column.
For each element in the chart, you can drill down to view the request activity, drill
across to view the requests in another visualization, or apply the specifics of that
element to the page filter. You can also use the Actions menu
![]() to view and download the request summary in the visualization. See Working with Dashboard Panels.
to view and download the request summary in the visualization. See Working with Dashboard Panels.
Closed Requests by (Request Type or Status)

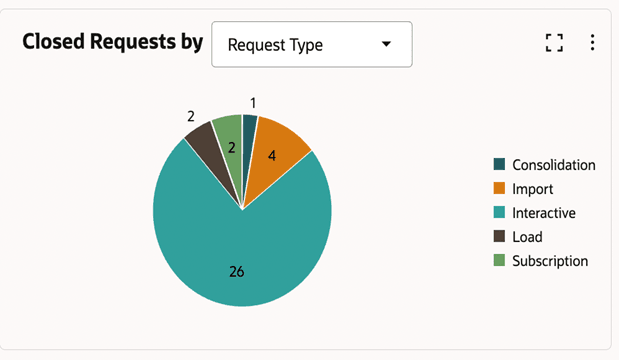
The Closed Requests by (Request Type or Status) panel displays the number of closed requests by either Request Type (such as Import, Interactive, or Subscription) or Request Status (such as Completed, Consolidated, or Rejected) over the time period specified in the filter bar.
For each element in the chart, you can drill down to view the request activity, drill
across to view the requests in another visualization, or apply the specifics of that
element to the page filter. You can also use the Actions menu
![]() to view and download the request summary in the visualization. See Working with Dashboard Panels.
to view and download the request summary in the visualization. See Working with Dashboard Panels.
Closed Requests by Priority

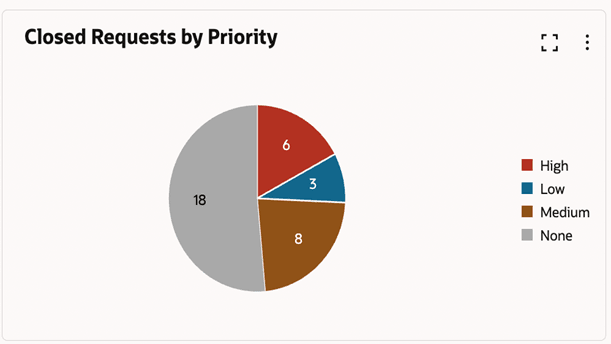
The Closed Requests by Priority panel displays the total number of closed requests of each priority over the time period that is specified in the filter bar.
For each element in the chart, you can drill down to view the request activity. You
can also use the Actions menu ![]() to view and download the request summary in the visualization. See Working with Dashboard Panels.
to view and download the request summary in the visualization. See Working with Dashboard Panels.