About the Report Designer
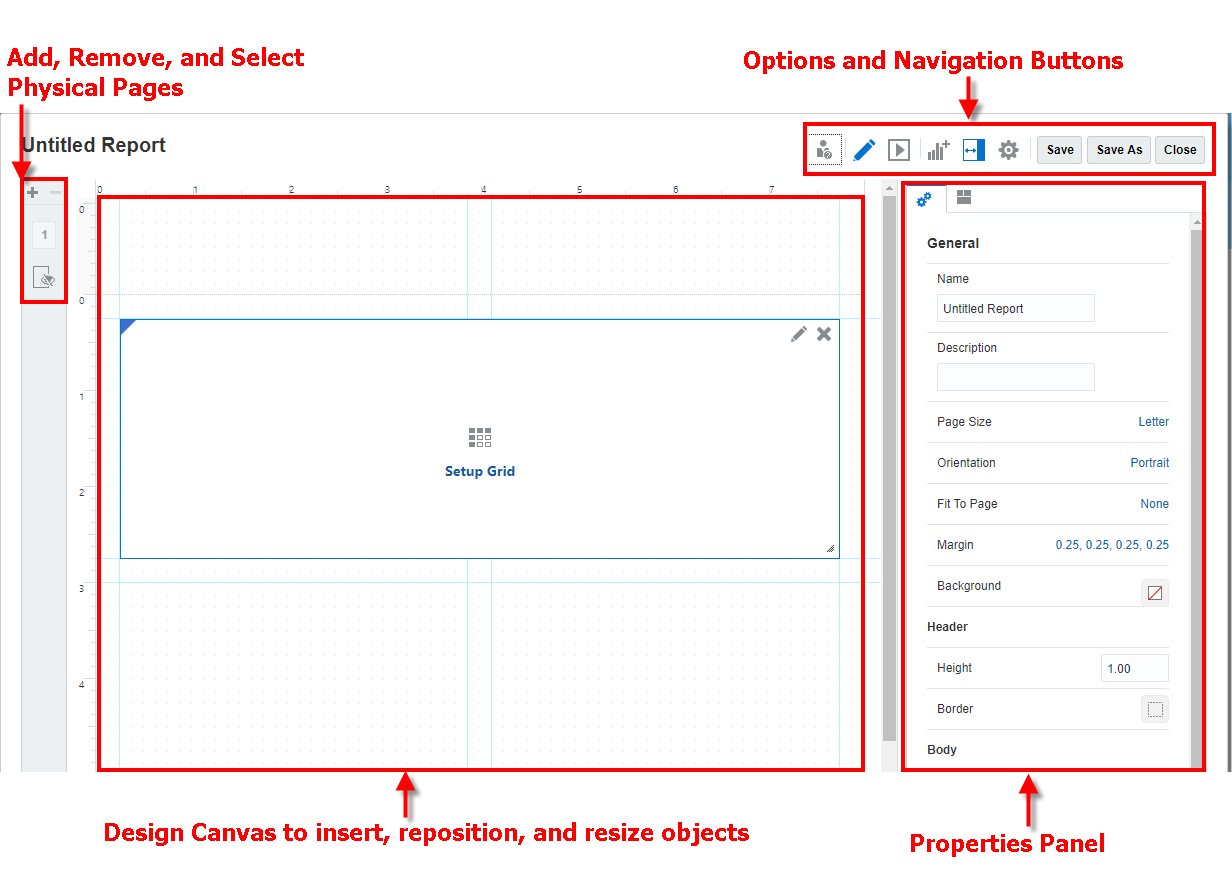
The report designer has the following areas:

-
From the left panel, you can add, delete, and select individual physical pages or sheets. The hidden sheet is where you can insert or paste grids that need to be hidden from the report output. The hidden sheet may contain grids that are created as part of a chart definition.
-
The design panel is where you insert report objects. You can reposition and resize report objects, and you can also drag and drop to resize the report header and footer. See Working with Report Objects.
Note:
The header and footer drag and drop only work from the ruler.
-
The toolbar lets you switch between edit and preview modes, insert and edit report objects, and change your view options. See Report Designer Toolbar
-
The properties panel lets you view and edit report properties. If you select a report object, the properties panel displays the properties of the report object. See Report Properties
-
The report name is displayed at the top of the report designer. When editing a report object, the object name will also be displayed at the top of the object designer, along with the report name.
Note:
When left-to-right text (English, Spanish, Korean, and so on.) is mixed with right-to-left text (Arabic, Hebrew, and so on.) between the report and object name and the current user locale uses a right-to-left reading direction, then each type of text is displayed using the direction it was entered in.
Default Report Layout
To save you time and effort, when you create a new report a default report layout is provided that offers the following:
-
Horizontal and vertical guides help you position objects with a meaningful and practical layout.
-
A grid is created. Click Setup Grid to set up the data source and other grid properties. See Working with Grids.