View the Auto-Routing Results Dashboard Chart
The Auto-Routing Results chart displays the number of auto-routed, manually routed, and not-routed activities in the selected bucket on the selected day.
This report has the following characteristics:
You can run this report for buckets or organizations. If you select an individual resource or organization in the Resource Tree, the report will be configured for the parent bucket.
It displays the share or auto-routed, manually routed or not-routed activities as a percentage of the whole number of activities in the selected bucket, which is assumed to be 100%. Breaks are not included.
If you have not run Routing, the report shows the message, 'No Data'.
The report calculates data for all child resources of the selected bucket (not only direct child resources but also their child resources, and so on).
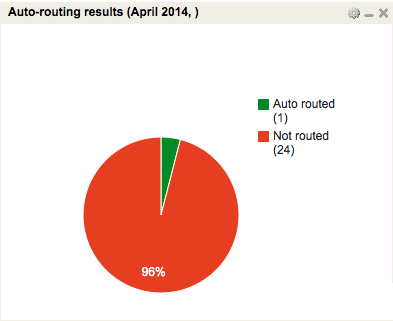
The Auto-Routing Results report is represented with a pie chart.
This figure shows the Auto-routing results dashboard report that calculates data for all child resources of a selected bucket.
To view the Auto-Routing Results Dashboard chart: