View the Routing Errors Reasons Report
The Routing errors reasons report shows the number of work orders that were not analyzed or processed by Oracle Fusion Field Service Routing and the reasons why such work orders could not be routed. This report displays the reasons for Not-routed activities by activity type for a selected date. Only the planned activities are considered for creating this report.
This report has the following characteristics:
You can run the report for buckets/aggregators. If you select an individual resource in the Resource Tree, the chart will be configured for the parent bucket/aggregator.
The report refreshes automatically every hour.
To view the Routing Errors Reasons report:
Results:
The pie chart represents the total number of work orders to be routed; the color of the "slices" indicate the reason why the work orders could not be routed: Work Zone errors, Work Skill errors, and other reasons such as missing address. Apart from differentiating the slices in colors, you can also view the details of the slice as text in the chart hints.
This figure shows the Routing errors reasons report displaying the number of work orders that were not analyzed or processed.
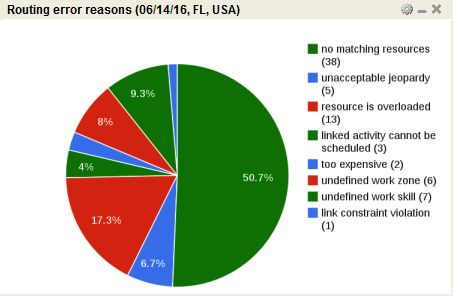
The chart options allow you to select a date from the calendar. You can also filter the display data by the activity type group for a selected bucket. The Routing errors reasons report is represented with a pie chart.
This table displays the elements in the Routing errors reasons report and their description:
| Element | Description |
|---|---|
| Header | Displays the report name and date. |
| Columns | The chart represents all the not-routed activities in the selected bucket on a specified day and is assumed to be 100%. Each slice represents the percentage share of the activities not-routed for a specific routing error reason. The chart may contain as many slices as there are routing error reasons. |
| Legend | Type of data represented by the chart:
|
| Hint | Each activity displays a hint pop-up with Routing error reason, number of activities not routed for that reason and percentage share. |