View the Percentage of Customer Expectations Met Report
The Percentage of customer expectations met report the number of activities started early, in time and late in a delivery window of a bucket/organization messaged to the customer. This report shows the percentage of activities (without teamwork and pre-work) that were started within the service window during a selected month. The total number of work orders that were completed by a resource is taken as 100%.
This report has the following characteristics:
You can run it for buckets/aggregators. If you select an individual resource in the Resource Tree, the chart will be configured for the parent bucket/aggregator.
It refreshes automatically every hour
The report does not include teamwork, non-customer activities, non-ordered activities, or pre-work
You can enter a value from 0 to 80 to define the interval during which any work orders started are considered “started on time”. (This is also known as “allowable lateness”.)
To view the Percentage of Customer Expectations Met report:
Results:
The total requirement is considered as 100 percent. Only the completed and not-done activities are taken into account. If an activity has no specified service window start and service window end data, it is not included in the report. The chart options lets you to select a date and add filter to display the data by display data for a particular activity type group or for any activity types represented in the list of activities in the selected bucket or organization. When you select a date from the calendar, the chart displays data for the period from the 1st of the month till the last date of the same month.
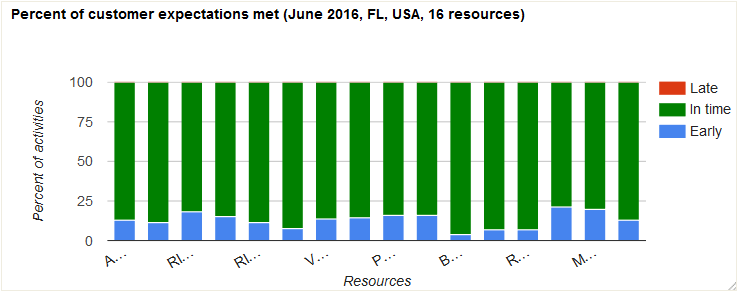
The Percent of Customer Expectations Met report is represented with a column chart.
This figure shows the Percent of Customer Expectations Met column chart displaying percentage of activities assigned to resources. Late, In time and Early activities are denoted in the chart.
This table displays the elements in the Percent of Customer Expectations report and their description:
| Element | Description |
|---|---|
| Header | Displays the report name, the reported period and the number of resources whose data is displayed on the chart. |
| Columns | Each column represents 100% of the resource’s not-done and completed activities. Each column may consist of the maximum of three parts marked in different colors representing the percentage share of activities started before the delivery window, in time and after the delivery window. Apart from differentiating the percentage share of activities in colors, you can also view them as text in the chart hints. |
| Legend | Type of data represented by the chart:
|
| Axes | horizontal: Resources vertical: Percent of activities |
| Hint | Each activity displays a hint pop-up with resource name and their percent of activities met. |