View the Percentage of Activities Met Report
The Percentage of activities met report displays the percentage of work orders completed by the resources that were started within the service window during a selected month.
This report displays the percent of activities that were started earlier than the activity service window end during the selected month. Activities collaborated with teamwork, pre-work and not-ordered activities are not considered during generating this chart.
This report has the following characteristics:
You can run it for buckets/aggregators. If you select an individual resource in the Resource Tree, the chart will be configured for the parent bucket/aggregator.
It refreshes automatically every hour
The chart does not include teamwork, non-customer activities, non-ordered activities, or pre-work
To view the Percentage of Activities Met report:
Results:
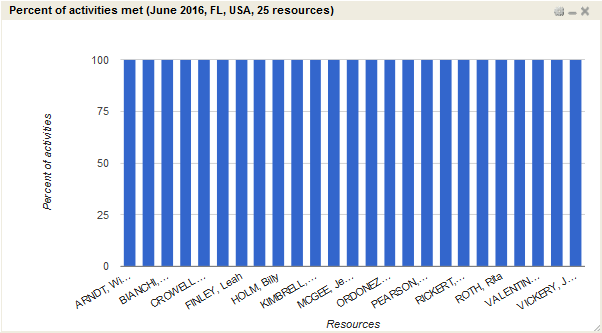
The Percent of Activities Met is displayed as a column chart in the Dashboard.
The horizontal axis lists individual resources by name; the vertical axis shows the percentage of work orders completed within the service window. Each column represents the work of one resource.
This figure shows the Percentage of activities met chart displaying the percent of completed work orders by a resource.
This table displays the elements in the Percent of Activities Met chart and their description:
| Element | Description |
|---|---|
| Header | Displays the report name, reported period and the number of resources whose data is displayed on the chart. |
| Columns | Denotes the percentage of activities started by each resource before the service window end. |
| Legend | The chart uses only one color to display data, therefore the chart has no legend. |
| Axes |
|
| Hint | Resource name and the percent of activities met. |