View the Resources by Statuses Report
The Resources by statuses report shows at a glance the proportion of resources that have activated their routes compared to those who did not activate in time and those who are not working today. This report shows status of activities such as percentage of non-working day, not activated route and active route for a selected date in the calendar.
The Resources by Statuses report is represented with a column chart. The chart options allows you to select a date from the calendar. The number of resources and statuses are listed against statuses for the selected date.
This table displays the elements in the Resources by Statuses report and their description:
| Element | Description |
|---|---|
| Header | Displays the report name and date. |
| Columns | The chart displays all the resources in the selected bucket or organization for the specified date. Each slice represents the percentage of the route status in the whole number. |
| Legend | The following statuses are available:
If resources of the selected bucket or organization have routes of only some of the statuses, the slices and the legend will contain only such statuses. |
| Hint | Each activity displays a hint with route status, number of resource routes of such status in the bucket or organization and their percentage share in the whole number of resources. |
This report has the following characteristics:
It depicts the number of resources for each status for the date that you select
You can run it for any bucket or organization
If you select an individual resource in the Resource Tree, the chart will be configured for the parent bucket
It refreshes automatically every 10 minutes
To view the Resources By Statuses report:
- Select one of the following date options from the drop-down
list:
Selected day– Reports for the day selected in the calendar
Day Before selected – Reports for the day before the one selected in the calendar
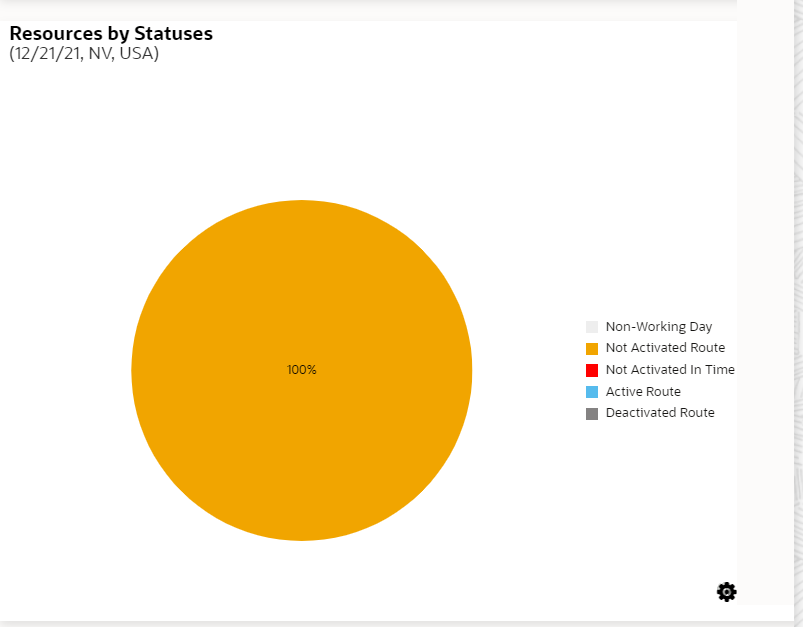
The whole pie chart represents the total number of resources in a bucket or organization. The status of each resource can be represented by a "slice."
This figure shows the Resources by statuses as a pie chart displaying the number of resources in a bucket.